Estimated Value: $159,000 - $177,000
2
Beds
1
Bath
996
Sq Ft
$168/Sq Ft
Est. Value
About This Home
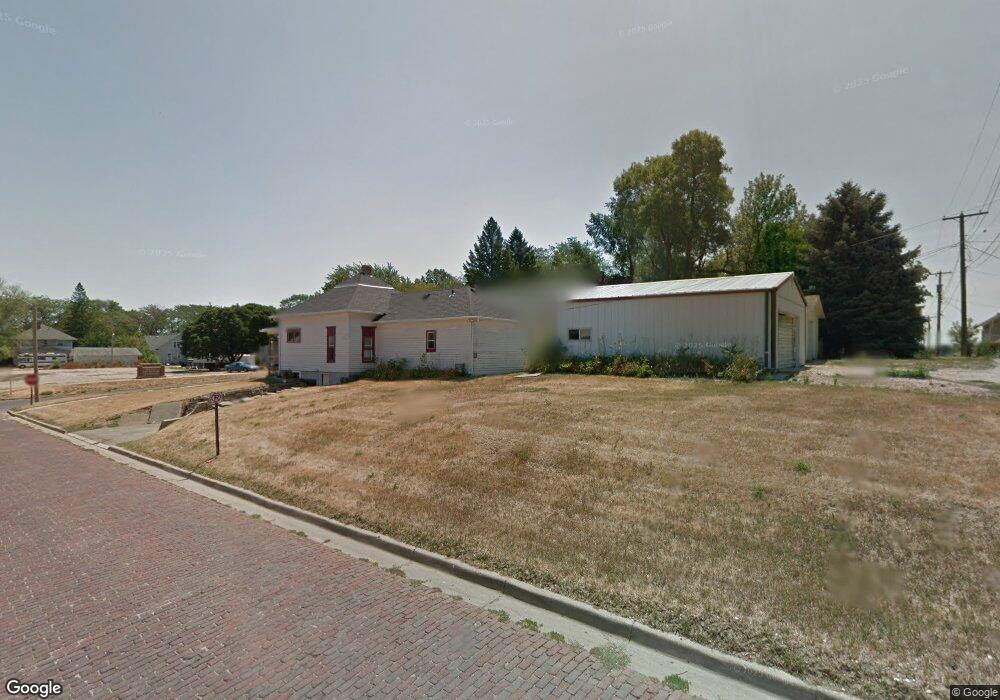
This home is located at 816 Logan St, Wayne, NE 68787 and is currently estimated at $167,391, approximately $168 per square foot. 816 Logan St is a home located in Wayne County with nearby schools including Wayne Elementary School, Wayne High School, and St. Mary Elementary School.
Ownership History
Date
Name
Owned For
Owner Type
Purchase Details
Closed on
Dec 24, 2015
Sold by
Moser Mark P and Barelman Jason L
Bought by
Pita 816 Llc
Current Estimated Value
Purchase Details
Closed on
Oct 26, 2015
Sold by
Ellis Justin
Bought by
Pita 816 Llc
Purchase Details
Closed on
Aug 15, 2014
Sold by
Collier Jerry W and Brien Jane M O
Bought by
Ellis Justin
Purchase Details
Closed on
May 23, 2007
Sold by
Hain Richard and Hain Carol R
Bought by
Collier Jerry W
Create a Home Valuation Report for This Property
The Home Valuation Report is an in-depth analysis detailing your home's value as well as a comparison with similar homes in the area
Home Values in the Area
Average Home Value in this Area
Purchase History
| Date | Buyer | Sale Price | Title Company |
|---|---|---|---|
| Pita 816 Llc | -- | None Available | |
| Pita 816 Llc | -- | None Available | |
| Ellis Justin | -- | None Available | |
| Moser Mark P | $80,000 | None Available | |
| Collier Jerry W | $71,000 | -- |
Source: Public Records
Tax History
| Year | Tax Paid | Tax Assessment Tax Assessment Total Assessment is a certain percentage of the fair market value that is determined by local assessors to be the total taxable value of land and additions on the property. | Land | Improvement |
|---|---|---|---|---|
| 2025 | $1,571 | $140,420 | $13,125 | $127,295 |
| 2024 | $1,571 | $124,025 | $7,245 | $116,780 |
| 2023 | $1,900 | $111,730 | $7,245 | $104,485 |
| 2022 | $1,756 | $100,670 | $7,245 | $93,425 |
| 2021 | $1,332 | $73,075 | $7,245 | $65,830 |
| 2020 | $1,182 | $66,055 | $7,245 | $58,810 |
| 2019 | $1,165 | $66,055 | $7,245 | $58,810 |
| 2018 | $1,184 | $66,055 | $7,245 | $58,810 |
| 2017 | $1,171 | $66,055 | $7,245 | $58,810 |
| 2016 | $1,238 | $0 | $0 | $0 |
| 2015 | $1,137 | $62,080 | $7,245 | $54,835 |
| 2014 | -- | $62,080 | $7,245 | $54,835 |
| 2013 | -- | $62,080 | $7,245 | $54,835 |
Source: Public Records
Map
Nearby Homes
Your Personal Tour Guide
Ask me questions while you tour the home.