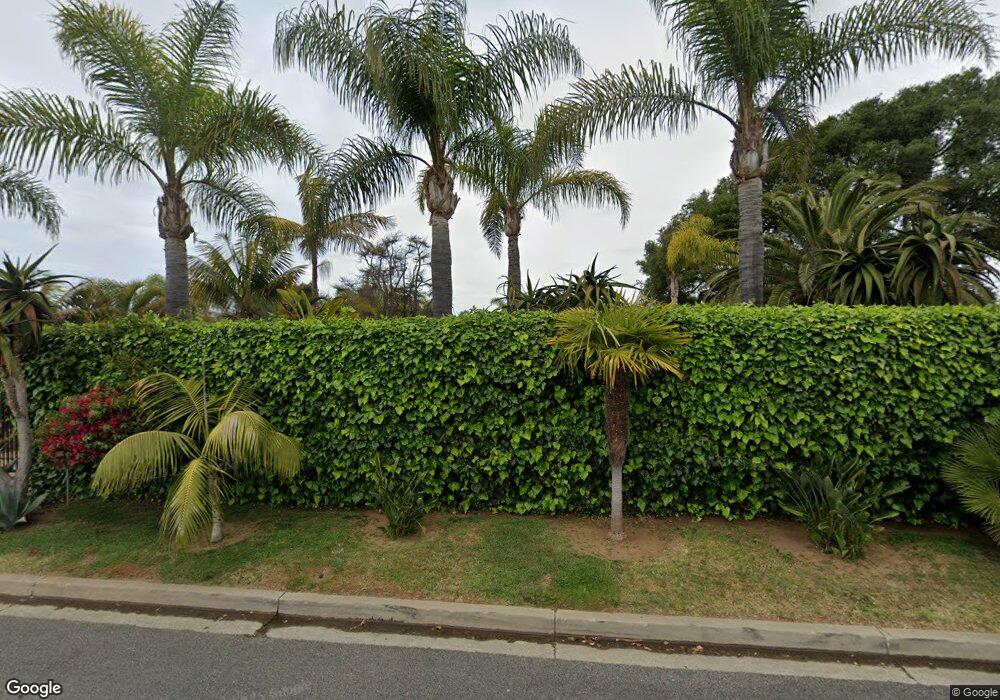
816 Morse St Oceanside, CA 92054
South Oceanside NeighborhoodEstimated Value: $1,449,870 - $1,976,000
3
Beds
4
Baths
2,162
Sq Ft
$753/Sq Ft
Est. Value
About This Home
This home is located at 816 Morse St, Oceanside, CA 92054 and is currently estimated at $1,628,718, approximately $753 per square foot. 816 Morse St is a home located in San Diego County with nearby schools including South Oceanside Elementary School, Lincoln Middle School, and Oceanside High School.
Ownership History
Date
Name
Owned For
Owner Type
Purchase Details
Closed on
Jul 9, 2001
Sold by
Quetives Rick Dean and Gavuzzi Donna
Bought by
Quetives Rick Dean and Gavuzzi Donna
Current Estimated Value
Purchase Details
Closed on
Feb 7, 1994
Sold by
Fowe Margaret E
Bought by
Quetives Rick Dean and Gavuzzi Donna
Home Financials for this Owner
Home Financials are based on the most recent Mortgage that was taken out on this home.
Original Mortgage
$120,000
Interest Rate
7.24%
Create a Home Valuation Report for This Property
The Home Valuation Report is an in-depth analysis detailing your home's value as well as a comparison with similar homes in the area
Home Values in the Area
Average Home Value in this Area
Purchase History
| Date | Buyer | Sale Price | Title Company |
|---|---|---|---|
| Quetives Rick Dean | -- | -- | |
| Quetives Rick Dean | $120,000 | Westland Title | |
| Quetives Rick Dean | $150,000 | Westland Title |
Source: Public Records
Mortgage History
| Date | Status | Borrower | Loan Amount |
|---|---|---|---|
| Closed | Quetives Rick Dean | $120,000 |
Source: Public Records
Tax History
| Year | Tax Paid | Tax Assessment Tax Assessment Total Assessment is a certain percentage of the fair market value that is determined by local assessors to be the total taxable value of land and additions on the property. | Land | Improvement |
|---|---|---|---|---|
| 2025 | $3,181 | $292,672 | $151,164 | $141,508 |
| 2024 | $3,181 | $286,934 | $148,200 | $138,734 |
| 2023 | $3,082 | $281,309 | $145,295 | $136,014 |
| 2022 | $3,034 | $275,795 | $142,447 | $133,348 |
| 2021 | $3,044 | $270,388 | $139,654 | $130,734 |
| 2020 | $2,950 | $267,617 | $138,223 | $129,394 |
| 2019 | $2,864 | $262,370 | $135,513 | $126,857 |
| 2018 | $2,832 | $257,226 | $132,856 | $124,370 |
| 2017 | $2,779 | $252,183 | $130,251 | $121,932 |
| 2016 | $2,687 | $247,240 | $127,698 | $119,542 |
| 2015 | $2,608 | $243,527 | $125,780 | $117,747 |
| 2014 | $2,507 | $238,758 | $123,317 | $115,441 |
Source: Public Records
Map
Nearby Homes
- 920 Morse St
- 1002 Morse St
- 1413 La Salina St
- 1573 Vista Del Mar Way Unit 4
- 120 Sherri Ln
- 1451 Machado St
- 1470 Burroughs St
- 1806 Stewart St
- 1504 Valencia St
- 1834 S Tremont St
- 122 Beechwood Ln
- 35 Parkwood Ln
- 1840 S Tremont St
- 1909-11 S Freeman St
- 1513 California St
- 912 S Tremont St
- 1409 S Pacific St
- 1324 S Pacific St Unit 3
- 1318 S Pacific St
- 215-217 S Myers St Unit 4 & 5
Your Personal Tour Guide
Ask me questions while you tour the home.