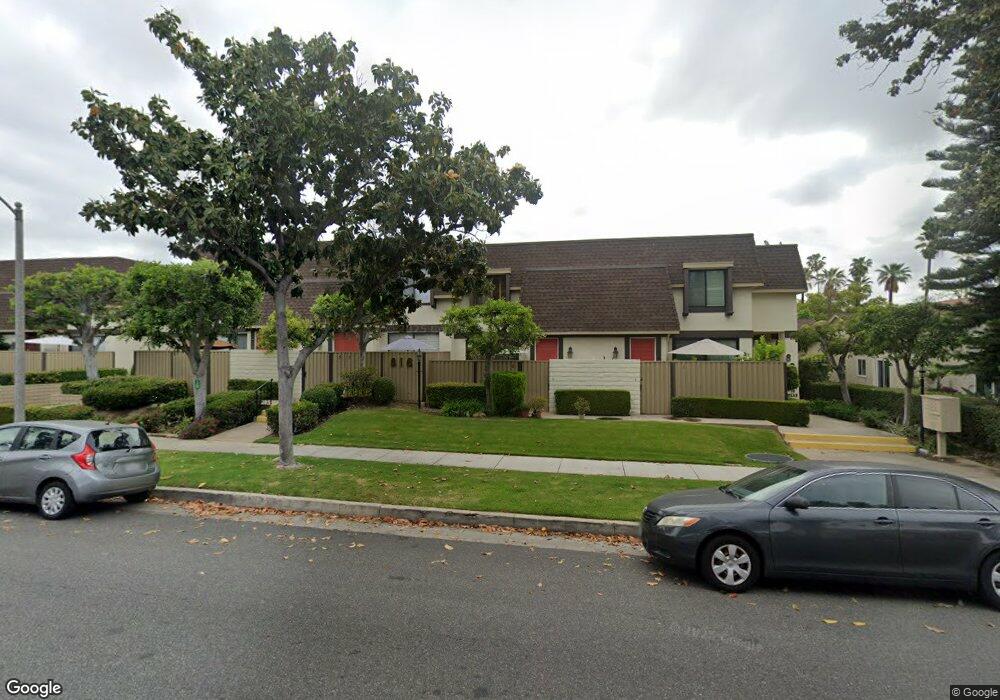
816 N Stoneman Ave Unit 1 Alhambra, CA 91801
Estimated Value: $775,000 - $895,000
3
Beds
3
Baths
1,575
Sq Ft
$526/Sq Ft
Est. Value
About This Home
This home is located at 816 N Stoneman Ave Unit 1, Alhambra, CA 91801 and is currently estimated at $829,147, approximately $526 per square foot. 816 N Stoneman Ave Unit 1 is a home located in Los Angeles County with nearby schools including Garfield Elementary School, Alhambra High School, and Saint Therese Carmelite School.
Ownership History
Date
Name
Owned For
Owner Type
Purchase Details
Closed on
Feb 19, 2021
Sold by
Link Diane Barbara
Bought by
Link Diane B and Diane B Link 2021 Trust
Current Estimated Value
Purchase Details
Closed on
Jul 2, 2014
Sold by
Yau Dolly
Bought by
Chi Iris Suying
Home Financials for this Owner
Home Financials are based on the most recent Mortgage that was taken out on this home.
Original Mortgage
$250,000
Outstanding Balance
$189,277
Interest Rate
4%
Mortgage Type
Adjustable Rate Mortgage/ARM
Estimated Equity
$639,870
Purchase Details
Closed on
Aug 4, 2004
Sold by
Muller George J and Muller Aleksandra
Bought by
Yau Dolly
Home Financials for this Owner
Home Financials are based on the most recent Mortgage that was taken out on this home.
Original Mortgage
$267,750
Interest Rate
1.37%
Mortgage Type
Negative Amortization
Create a Home Valuation Report for This Property
The Home Valuation Report is an in-depth analysis detailing your home's value as well as a comparison with similar homes in the area
Home Values in the Area
Average Home Value in this Area
Purchase History
| Date | Buyer | Sale Price | Title Company |
|---|---|---|---|
| Link Diane B | -- | None Available | |
| Chi Iris Suying | $500,005 | Wfg Title Company | |
| Yau Dolly | $382,500 | Chicago |
Source: Public Records
Mortgage History
| Date | Status | Borrower | Loan Amount |
|---|---|---|---|
| Open | Chi Iris Suying | $250,000 | |
| Previous Owner | Yau Dolly | $267,750 |
Source: Public Records
Tax History Compared to Growth
Tax History
| Year | Tax Paid | Tax Assessment Tax Assessment Total Assessment is a certain percentage of the fair market value that is determined by local assessors to be the total taxable value of land and additions on the property. | Land | Improvement |
|---|---|---|---|---|
| 2025 | $7,214 | $600,913 | $424,969 | $175,944 |
| 2024 | $7,214 | $589,132 | $416,637 | $172,495 |
| 2023 | $7,128 | $577,581 | $408,468 | $169,113 |
| 2022 | $6,780 | $566,257 | $400,459 | $165,798 |
| 2021 | $6,705 | $555,155 | $392,607 | $162,548 |
| 2020 | $6,668 | $549,464 | $388,582 | $160,882 |
| 2019 | $6,463 | $538,691 | $380,963 | $157,728 |
| 2018 | $6,504 | $528,130 | $373,494 | $154,636 |
| 2016 | $5,971 | $507,624 | $358,992 | $148,632 |
| 2015 | $5,880 | $500,000 | $353,600 | $146,400 |
| 2014 | $5,258 | $434,929 | $321,452 | $113,477 |
Source: Public Records
Map
Nearby Homes
- 909 N Stoneman Ave
- 925 N Stoneman Ave Unit A
- 920 N 1st St
- 917 N Olive Ave
- 333 N Chapel Ave Unit A
- 543 Huntington Dr
- 508 N Hidalgo Ave
- 212 N Stoneman Ave Unit E
- 621 N Granada Ave
- 210 N Monterey St Unit 208
- 1416 Wilson Ave
- 501 N Olive Ave
- 829 N Electric Ave
- 801 N Electric Ave
- 105 N Almansor St Unit 4
- 1832 Bushnell Ave
- 1617 Wayne Ave
- 480 Plymouth Rd
- 200 N 5th St Unit 311
- 200 N 5th St Unit 108
- 816 N Stoneman Ave Unit G
- 816 N Stoneman Ave Unit H
- 815 N Monterey St Unit 2
- 815 N Monterey St Unit 1
- 813 N Monterey St Unit 3
- 820 N Stoneman Ave Unit 3
- 820 N Stoneman Ave Unit 2
- 820 N Stoneman Ave Unit 1
- 816 N Stoneman Ave Unit 2
- 816 N Stoneman Ave Unit 3
- 816 N Stoneman Ave Unit 4
- 818 N Stoneman Ave Unit 1
- 818 N Stoneman Ave Unit 2
- 818 N Stoneman Ave Unit 3
- 818 N Stoneman Ave Unit 4
- 818 N Stoneman Ave Unit 5
- 818 N Stoneman Ave Unit 6
- 813 N Monterey St Unit 2
- 813 N Monterey St Unit 1
- 820 N Stoneman Ave Unit 11