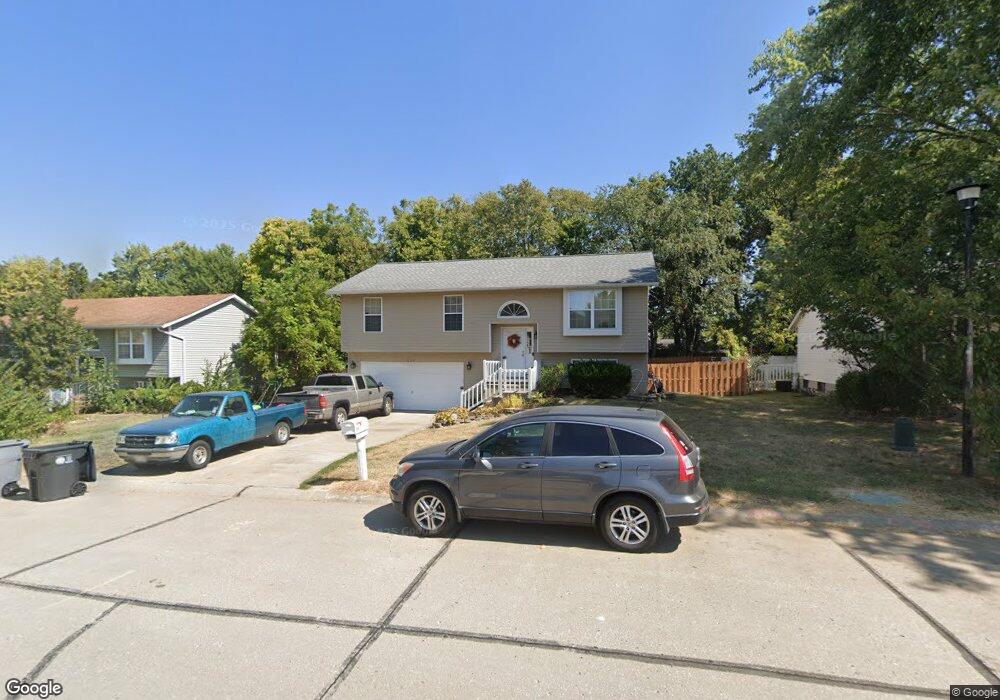
816 N Valleywind Ct O Fallon, MO 63366
Estimated Value: $305,000 - $318,962
3
Beds
2
Baths
1,124
Sq Ft
$277/Sq Ft
Est. Value
About This Home
This home is located at 816 N Valleywind Ct, O Fallon, MO 63366 and is currently estimated at $311,741, approximately $277 per square foot. 816 N Valleywind Ct is a home located in St. Charles County with nearby schools including Joseph L. Mudd Elementary School, Forest Park Elementary School, and Fort Zumwalt South Middle School.
Ownership History
Date
Name
Owned For
Owner Type
Purchase Details
Closed on
Nov 30, 2007
Sold by
Garcia Mario and Ayala Danielle
Bought by
Crawford Christopher and Crawford Maria Del Rosario
Current Estimated Value
Home Financials for this Owner
Home Financials are based on the most recent Mortgage that was taken out on this home.
Original Mortgage
$118,000
Outstanding Balance
$75,074
Interest Rate
6.4%
Mortgage Type
Purchase Money Mortgage
Estimated Equity
$236,667
Purchase Details
Closed on
Aug 3, 2007
Sold by
Siesener Timothy and Siesener Michelle
Bought by
Garcia Mario
Purchase Details
Closed on
Feb 18, 1999
Sold by
Zimmerman Darwin J Jr Mary L
Bought by
Siesener Timothy and Siesener Michelle
Home Financials for this Owner
Home Financials are based on the most recent Mortgage that was taken out on this home.
Original Mortgage
$100,848
Interest Rate
6.83%
Mortgage Type
FHA
Create a Home Valuation Report for This Property
The Home Valuation Report is an in-depth analysis detailing your home's value as well as a comparison with similar homes in the area
Home Values in the Area
Average Home Value in this Area
Purchase History
| Date | Buyer | Sale Price | Title Company |
|---|---|---|---|
| Crawford Christopher | $156,000 | Investors Title Company | |
| Garcia Mario | -- | None Available | |
| Siesener Timothy | -- | -- |
Source: Public Records
Mortgage History
| Date | Status | Borrower | Loan Amount |
|---|---|---|---|
| Open | Crawford Christopher | $118,000 | |
| Previous Owner | Siesener Timothy | $100,848 |
Source: Public Records
Tax History Compared to Growth
Tax History
| Year | Tax Paid | Tax Assessment Tax Assessment Total Assessment is a certain percentage of the fair market value that is determined by local assessors to be the total taxable value of land and additions on the property. | Land | Improvement |
|---|---|---|---|---|
| 2025 | $3,068 | $50,511 | -- | -- |
| 2023 | $3,069 | $46,244 | $0 | $0 |
| 2022 | $2,545 | $35,599 | $0 | $0 |
| 2021 | $2,547 | $35,599 | $0 | $0 |
| 2020 | $2,431 | $32,950 | $0 | $0 |
| 2019 | $2,437 | $32,950 | $0 | $0 |
| 2018 | $2,502 | $32,322 | $0 | $0 |
| 2017 | $2,466 | $32,322 | $0 | $0 |
| 2016 | $2,211 | $28,867 | $0 | $0 |
| 2015 | $2,056 | $28,867 | $0 | $0 |
| 2014 | $1,962 | $27,092 | $0 | $0 |
Source: Public Records
Map
Nearby Homes
- 8 Belleau Lake Ct
- 256 Barrington Dr
- 9 Schrader Farm Ct
- 1508 Belleau Lake Dr
- 1603 Belleau Lake Dr
- 8360 Mexico Rd
- 1005 Belleau Creek Rd
- Adams Plan at Strawberry Farms - Liberty Series
- Franklin Plan at Strawberry Farms - Liberty Series
- Madison Plan at Strawberry Farms - Liberty Series
- Hamilton II Plan at Strawberry Farms - Liberty Series
- Washington Plan at Strawberry Farms - Liberty Series
- 21 Saali Dr
- 501 Wycombe Dr
- 503 Wycombe Dr
- 8201 Bristol Valley Dr
- 175 Blue Water Dr
- 117 Blue Water Dr
- 164 Blue Water Dr
- 212 Natural Spring Dr
- 812 N Valleywind Ct
- 820 S Valleywind Ct
- 808 N Valleywind Ct
- 824 S Valleywind Ct
- 813 N Valleywind Ct
- 823 S Valleywind Ct
- 809 N Valleywind Ct
- 804 N Valleywind Ct
- 1101 Belleau Lake Dr
- 827 S Valleywind Ct
- 842 Summersong Dr
- 839 Summersong Dr
- 805 N Valleywind Ct
- 1103 Belleau Lake Dr
- 800 N Valleywind Ct
- 832 S Valleywind Ct
- 801 N Valleywind Ct
- 4 Windstone Ct
- 1105 Belleau Lake Dr
- 831 S Valleywind Ct