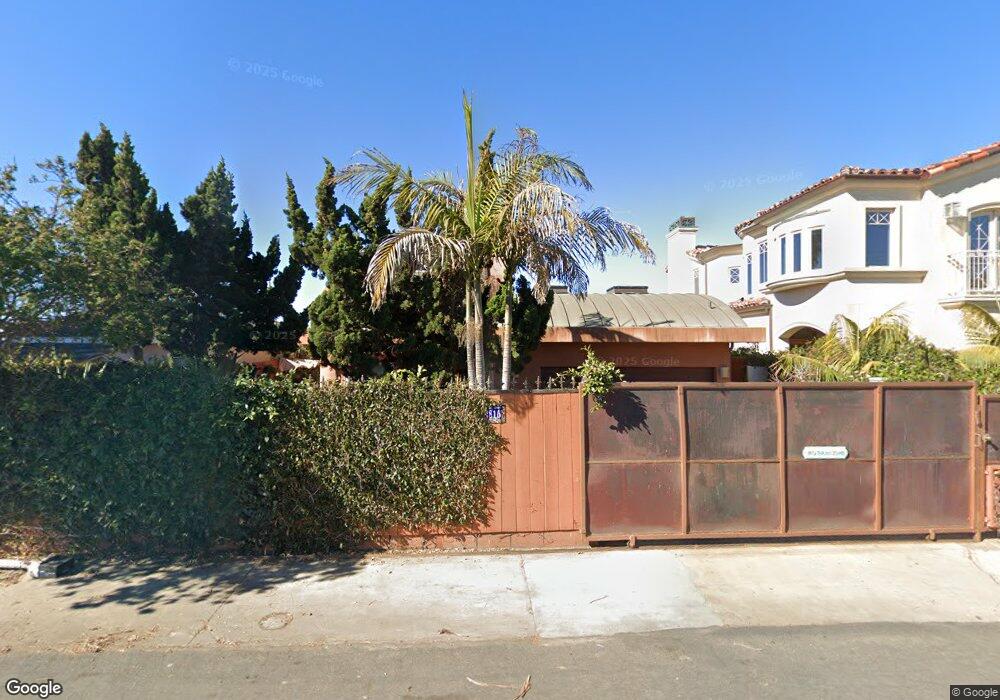
816 Neptune Ave Encinitas, CA 92024
Leucadia NeighborhoodEstimated Value: $2,805,000 - $4,441,000
3
Beds
3
Baths
2,190
Sq Ft
$1,481/Sq Ft
Est. Value
About This Home
This home is located at 816 Neptune Ave, Encinitas, CA 92024 and is currently estimated at $3,243,906, approximately $1,481 per square foot. 816 Neptune Ave is a home located in San Diego County with nearby schools including Paul Ecke-Central Elementary, Diegueno Middle School, and La Costa Canyon High School.
Ownership History
Date
Name
Owned For
Owner Type
Purchase Details
Closed on
Jun 27, 2024
Sold by
Sorich Christopher Dalton
Bought by
Sorich
Current Estimated Value
Purchase Details
Closed on
Dec 31, 2012
Sold by
Sorich Richard A and Sorich Patricia A
Bought by
Farnam Michelle Dawn and Sorich Austin Anthony
Purchase Details
Closed on
Dec 30, 2009
Sold by
Sorich Richard A and Sorich Patricia A
Bought by
Farnam Michelle Dawn and Sorich Austin Anthony
Purchase Details
Closed on
Dec 28, 2007
Sold by
Sorich Richard A and Sorich Patricia A
Bought by
Farnam Michelle Dawn and Sorich Austin Anthony
Purchase Details
Closed on
Apr 9, 2004
Sold by
Sorich Richard A and Sorich Patricia A
Bought by
Sorich Richard A and Sorich Patricia A
Purchase Details
Closed on
Dec 30, 2003
Sold by
Sorich Richard A and Sorich Patricia A
Bought by
Johnson Michelle Dawn and Sorich Austin Anthony
Purchase Details
Closed on
Jun 1, 2000
Sold by
Estrada Gabriel B and Estrada Rebecca J
Bought by
Estrada Gabriel B and Estrada Rebecca J
Create a Home Valuation Report for This Property
The Home Valuation Report is an in-depth analysis detailing your home's value as well as a comparison with similar homes in the area
Home Values in the Area
Average Home Value in this Area
Purchase History
| Date | Buyer | Sale Price | Title Company |
|---|---|---|---|
| Sorich | -- | None Listed On Document | |
| Farnam Michelle Dawn | -- | None Available | |
| Farnam Michelle Dawn | -- | None Available | |
| Farnam Michelle Dawn | -- | None Available | |
| Sorich Richard A | -- | -- | |
| Johnson Michelle Dawn | -- | -- | |
| Johnson Michelle Dawn | -- | -- | |
| Estrada Gabriel B | -- | Chicago Title Co |
Source: Public Records
Tax History
| Year | Tax Paid | Tax Assessment Tax Assessment Total Assessment is a certain percentage of the fair market value that is determined by local assessors to be the total taxable value of land and additions on the property. | Land | Improvement |
|---|---|---|---|---|
| 2025 | $16,073 | $1,448,651 | $881,498 | $567,153 |
| 2024 | $16,073 | $1,420,247 | $864,214 | $556,033 |
| 2023 | $15,610 | $1,392,400 | $847,269 | $545,131 |
| 2022 | $15,234 | $1,365,099 | $830,656 | $534,443 |
| 2021 | $14,976 | $1,338,333 | $814,369 | $523,964 |
| 2020 | $14,729 | $1,324,611 | $806,019 | $518,592 |
| 2019 | $14,436 | $1,298,639 | $790,215 | $508,424 |
| 2018 | $14,161 | $1,273,176 | $774,721 | $498,455 |
| 2017 | $13,916 | $1,248,213 | $759,531 | $488,682 |
| 2016 | $13,486 | $1,223,739 | $744,639 | $479,100 |
| 2015 | $13,243 | $1,205,358 | $733,454 | $471,904 |
| 2014 | -- | $1,181,748 | $719,087 | $462,661 |
Source: Public Records
Map
Nearby Homes
- 123 Jasper St
- 123 Jasper St Unit spc 35
- 123 Jasper St Unit 38
- 123 Jasper St Unit 16
- 159 Diana St Unit 4
- 674 Calypso Place
- 149 W Glaucus St Unit D
- 170 Diana St
- 699 N Vulcan Ave Unit 17
- 699 N Vulcan Ave Unit 133
- 699 N Vulcan Ave Unit 134
- 699 N Vulcan Ave Unit 80
- 699 N Vulcan Ave Unit 56
- 806 Hygeia Ave
- 600 N Coast Highway 101
- 698 Hygeia Ave
- 251 E Glaucus St
- 510 Neptune Ave
- 374 Fulvia St
- 498 Neptune Ave
- 808 Neptune Ave
- 824 Neptune Ave Unit 3
- 824 Neptune Ave Unit 1
- 824 Neptune Ave Unit 6
- 824 Neptune Ave Unit 4
- 824 Neptune Ave Unit 2
- 824 Neptune Ave Unit 7
- 824 Neptune Ave Unit 5
- 828 Neptune Ave
- 798 Neptune Ave
- 0 Neptune Ave
- 805 Neptune Ave Unit 805A
- 796 Neptune Ave
- 836 Neptune Ave
- 836 Neptune Ave
- 838 Neptune Ave Unit 2
- 838 Neptune Ave
- 819 Neptune Ave
- 856 Neptune Ave
- 794 Neptune Ave
Your Personal Tour Guide
Ask me questions while you tour the home.