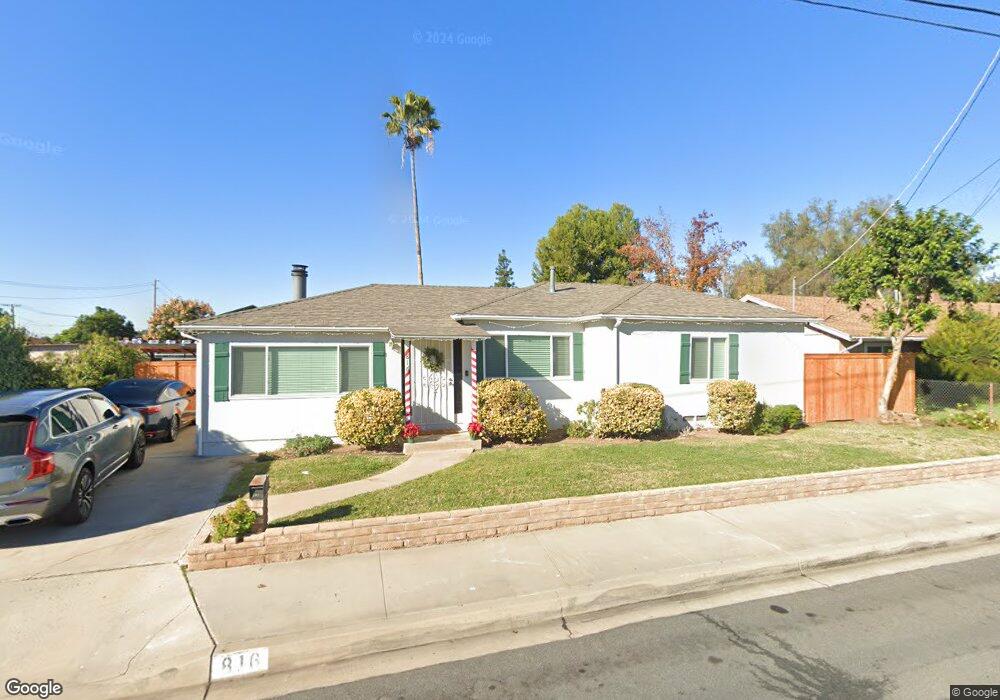
816 Oro St El Cajon, CA 92021
Estimated Value: $681,000 - $726,617
3
Beds
1
Bath
1,235
Sq Ft
$573/Sq Ft
Est. Value
About This Home
This home is located at 816 Oro St, El Cajon, CA 92021 and is currently estimated at $708,154, approximately $573 per square foot. 816 Oro St is a home located in San Diego County with nearby schools including Naranca Elementary School, Cajon Valley Middle School, and El Cajon Valley High School.
Ownership History
Date
Name
Owned For
Owner Type
Purchase Details
Closed on
Nov 20, 2024
Sold by
Sanchez Ritchie and Sanchez Kayla
Bought by
Sanchez Family Trust and Sanchez
Current Estimated Value
Purchase Details
Closed on
Mar 27, 2018
Sold by
Ball David
Bought by
Sanchez Richie and Sanchez Kayla
Home Financials for this Owner
Home Financials are based on the most recent Mortgage that was taken out on this home.
Original Mortgage
$430,000
Interest Rate
4.46%
Mortgage Type
VA
Purchase Details
Closed on
Dec 6, 2017
Sold by
Ball Kelly Camille
Bought by
Ball David
Purchase Details
Closed on
Nov 22, 2017
Sold by
Willson Richard D and Willson Susan M
Bought by
Ball David
Purchase Details
Closed on
Nov 6, 2006
Sold by
Willson Richard D and Willson Susan M
Bought by
Willson Richard D and Willson Susan M
Create a Home Valuation Report for This Property
The Home Valuation Report is an in-depth analysis detailing your home's value as well as a comparison with similar homes in the area
Purchase History
| Date | Buyer | Sale Price | Title Company |
|---|---|---|---|
| Sanchez Family Trust | -- | None Listed On Document | |
| Sanchez Family Trust | -- | None Listed On Document | |
| Sanchez Richie | $430,000 | Stewart Title Company | |
| Ball David | -- | First American Title Insuran | |
| Ball David | $315,000 | First American Title Insuran | |
| Willson Richard D | -- | None Available |
Source: Public Records
Mortgage History
| Date | Status | Borrower | Loan Amount |
|---|---|---|---|
| Previous Owner | Sanchez Richie | $430,000 |
Source: Public Records
Tax History
| Year | Tax Paid | Tax Assessment Tax Assessment Total Assessment is a certain percentage of the fair market value that is determined by local assessors to be the total taxable value of land and additions on the property. | Land | Improvement |
|---|---|---|---|---|
| 2025 | $4,658 | $489,261 | $124,191 | $365,070 |
| 2024 | $4,658 | $479,668 | $121,756 | $357,912 |
| 2023 | $4,624 | $470,264 | $119,369 | $350,895 |
| 2022 | $4,443 | $461,044 | $117,029 | $344,015 |
| 2021 | $4,835 | $452,005 | $114,735 | $337,270 |
| 2020 | $5,883 | $447,371 | $113,559 | $333,812 |
| 2019 | $5,370 | $438,600 | $111,333 | $327,267 |
| 2018 | $3,881 | $315,000 | $79,959 | $235,041 |
| 2017 | $858 | $66,578 | $16,900 | $49,678 |
| 2016 | $824 | $65,273 | $16,569 | $48,704 |
| 2015 | $820 | $64,294 | $16,321 | $47,973 |
| 2014 | $805 | $63,036 | $16,002 | $47,034 |
Source: Public Records
Map
Nearby Homes
- 1145 Sumner Ave
- 1122-24 Oro St
- 917 N 1st St
- 514 Shady Ln Unit C
- 540 Oakdale Ln Unit C
- 1244 E Madison Ave Unit C
- 1045 Peach Ave Unit 61
- 503 N 1st St Unit 42B
- 1229 E Madison Ave
- 1372 Marline Ave
- 1263 Jeannine Ln
- 389 Shady Ln Unit D
- 1255 Jeannine Ln
- 1161 N Anza St
- 1383-87 Oakdale Ave
- 522 Mary Ln
- 359 N 1st St
- 390 N 1st St Unit 23
- 930 Peach Ave Unit 19
- 1345 E Madison Ave Unit 5
- 826 Oro St
- 1190 Marline Ave
- 1198 Marline Ave
- 1194 Marline Ave
- 1184 Marline Ave
- 1200 Marline Ave
- 825 Oro St
- 833 Oro St
- 1178 Marline Ave
- 1178 Marline Ave Unit 80
- 1191 Peach Ave Unit 99
- 1177 Peach Ave
- 1185 Peach Ave
- 1201 Peach Ave
- 1202 Marline Ave Unit 6
- 1175 Peach Ave
- 1174 Marline Ave
- 1191 Marline Ave
- 1173 Peach Ave
- 1210 Marline Ave Unit 12
Your Personal Tour Guide
Ask me questions while you tour the home.