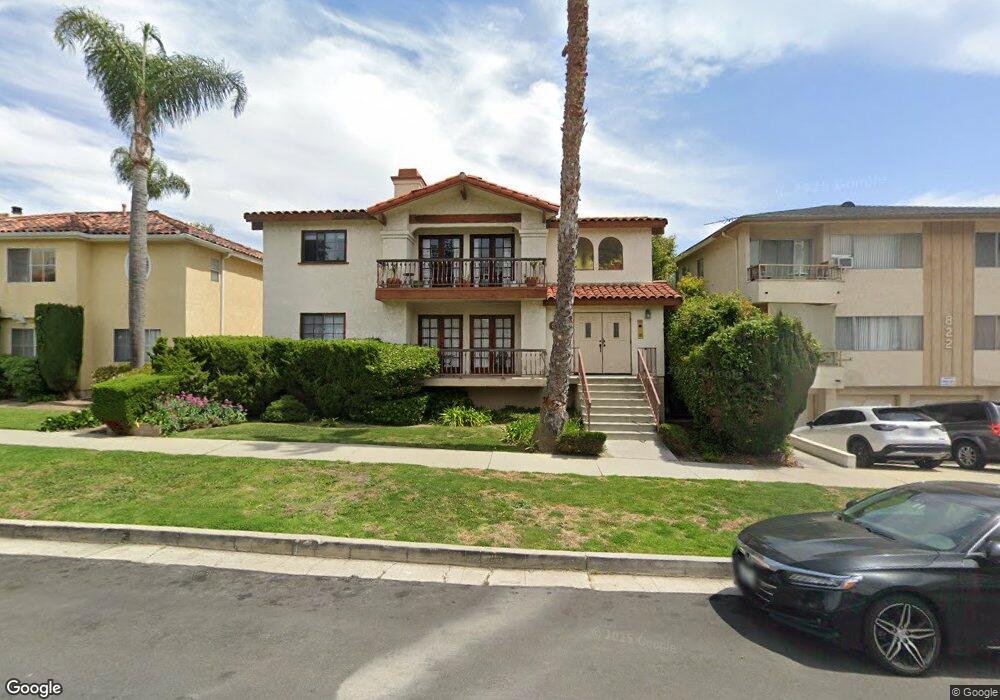
816 S Leland St Unit 6 San Pedro, CA 90731
Estimated Value: $574,000 - $708,000
2
Beds
2
Baths
1,179
Sq Ft
$517/Sq Ft
Est. Value
About This Home
This home is located at 816 S Leland St Unit 6, San Pedro, CA 90731 and is currently estimated at $609,509, approximately $516 per square foot. 816 S Leland St Unit 6 is a home located in Los Angeles County with nearby schools including Seventh Street Elementary School, Dana Middle School, and San Pedro Senior High School.
Ownership History
Date
Name
Owned For
Owner Type
Purchase Details
Closed on
Aug 13, 2019
Sold by
Cowan Carol A
Bought by
Denola Mayla
Current Estimated Value
Home Financials for this Owner
Home Financials are based on the most recent Mortgage that was taken out on this home.
Original Mortgage
$315,000
Outstanding Balance
$271,158
Interest Rate
2.9%
Mortgage Type
Adjustable Rate Mortgage/ARM
Estimated Equity
$338,351
Purchase Details
Closed on
May 22, 2015
Sold by
Cowan Carol Ann
Bought by
Cowan Carol A and Carol A Cowan Revocable Trust
Purchase Details
Closed on
Feb 14, 1995
Sold by
Federal Home Loan Mortgage Corporation
Bought by
Cowan Carol Ann
Home Financials for this Owner
Home Financials are based on the most recent Mortgage that was taken out on this home.
Original Mortgage
$75,000
Interest Rate
6.5%
Purchase Details
Closed on
Mar 23, 1994
Sold by
National Home Mtg Corp
Bought by
Federal Home Loan Mortgage Corporation
Create a Home Valuation Report for This Property
The Home Valuation Report is an in-depth analysis detailing your home's value as well as a comparison with similar homes in the area
Home Values in the Area
Average Home Value in this Area
Purchase History
| Date | Buyer | Sale Price | Title Company |
|---|---|---|---|
| Denola Mayla | $420,000 | Lawyers Title Company | |
| Cowan Carol A | -- | None Available | |
| Cowan Carol Ann | $125,000 | World Title Company | |
| Federal Home Loan Mortgage Corporation | $140,000 | Chicago Title Company |
Source: Public Records
Mortgage History
| Date | Status | Borrower | Loan Amount |
|---|---|---|---|
| Open | Denola Mayla | $315,000 | |
| Previous Owner | Cowan Carol Ann | $75,000 |
Source: Public Records
Tax History Compared to Growth
Tax History
| Year | Tax Paid | Tax Assessment Tax Assessment Total Assessment is a certain percentage of the fair market value that is determined by local assessors to be the total taxable value of land and additions on the property. | Land | Improvement |
|---|---|---|---|---|
| 2025 | $5,480 | $459,326 | $229,226 | $230,100 |
| 2024 | $5,480 | $450,321 | $224,732 | $225,589 |
| 2023 | $5,372 | $441,492 | $220,326 | $221,166 |
| 2022 | $5,119 | $432,836 | $216,006 | $216,830 |
| 2021 | $5,051 | $424,350 | $211,771 | $212,579 |
| 2019 | $2,272 | $188,194 | $37,630 | $150,564 |
| 2018 | $2,250 | $184,505 | $36,893 | $147,612 |
| 2016 | $2,135 | $177,342 | $35,461 | $141,881 |
| 2015 | $2,104 | $174,679 | $34,929 | $139,750 |
| 2014 | -- | $171,258 | $34,245 | $137,013 |
Source: Public Records
Map
Nearby Homes
- 719 Oro Terrace
- 1110 W 10th St Unit 105
- 990 W 9th St
- 1018 S Leland St Unit 1
- 514 Arcadia Dr
- 1024 S Leland St
- 974 W 5th St
- 1260 W 9th St
- 927 W 6th St
- 1038 S Walker Ave
- 1041 W 11th St
- 1120 S Leland St
- 935 W 10th St
- 1155 S Leland St Unit 2
- 1307 W 7th St Unit 8
- 1321 W 9th St
- 972 W 12th St
- 1100 S Patton Ave
- 1145 W 2nd St
- 1010 W 13th St
- 816 S Leland St Unit 5
- 816 S Leland St Unit 4
- 816 S Leland St Unit 3
- 816 S Leland St Unit 2
- 816 S Leland St Unit 1
- 804 S Leland St Unit 3
- 804 S Leland St
- 1083 W 8th St Unit 2
- 1083 W 8th St
- 1073 W 8th St
- 832 S Leland St
- 1080 W 9th St
- 1061 W 8th St Unit 4
- 1061 W 8th St Unit 2
- 1061 W 8th St
- 834 S Leland St
- 740 S Leland St
- 815 S Leland St
- 817 S Leland St
- 825 S Leland St