Estimated Value: $350,195 - $428,000
4
Beds
2
Baths
2,528
Sq Ft
$157/Sq Ft
Est. Value
About This Home
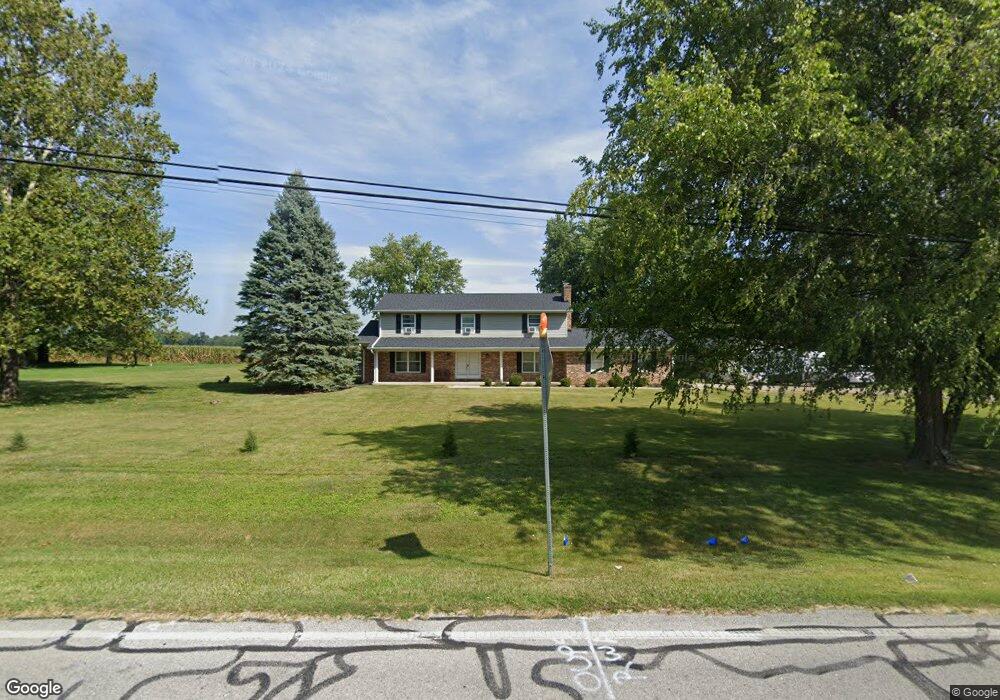
This home is located at 816 W Main St, Eaton, OH 45320 and is currently estimated at $396,799, approximately $156 per square foot. 816 W Main St is a home located in Preble County with nearby schools including Hollingsworth East Elementary School, William Bruce Elementary School, and Eaton Middle School.
Ownership History
Date
Name
Owned For
Owner Type
Purchase Details
Closed on
Jan 20, 2014
Sold by
French Bret A
Bought by
Combs Carol A
Current Estimated Value
Home Financials for this Owner
Home Financials are based on the most recent Mortgage that was taken out on this home.
Original Mortgage
$174,489
Outstanding Balance
$131,881
Interest Rate
4.42%
Mortgage Type
New Conventional
Estimated Equity
$264,918
Purchase Details
Closed on
Oct 5, 2011
Sold by
Holtzmuller John H
Bought by
French Bret A
Home Financials for this Owner
Home Financials are based on the most recent Mortgage that was taken out on this home.
Original Mortgage
$151,200
Interest Rate
4.23%
Mortgage Type
New Conventional
Purchase Details
Closed on
Mar 9, 2010
Sold by
Holtzmuller Paul E
Bought by
Holtzmuller Paul E and Paul E Holtzmuller 2010 Trust
Purchase Details
Closed on
Oct 1, 1983
Bought by
Combs Carol A
Create a Home Valuation Report for This Property
The Home Valuation Report is an in-depth analysis detailing your home's value as well as a comparison with similar homes in the area
Home Values in the Area
Average Home Value in this Area
Purchase History
| Date | Buyer | Sale Price | Title Company |
|---|---|---|---|
| Combs Carol A | $171,000 | Partners Land Title Agency L | |
| French Bret A | $252,000 | Freedom Title | |
| Holtzmuller Paul E | -- | None Available | |
| Combs Carol A | $86,000 | -- |
Source: Public Records
Mortgage History
| Date | Status | Borrower | Loan Amount |
|---|---|---|---|
| Open | Combs Carol A | $174,489 | |
| Previous Owner | French Bret A | $151,200 |
Source: Public Records
Tax History Compared to Growth
Tax History
| Year | Tax Paid | Tax Assessment Tax Assessment Total Assessment is a certain percentage of the fair market value that is determined by local assessors to be the total taxable value of land and additions on the property. | Land | Improvement |
|---|---|---|---|---|
| 2024 | $3,168 | $91,740 | $19,530 | $72,210 |
| 2023 | $3,168 | $91,740 | $19,530 | $72,210 |
| 2022 | $3,153 | $75,570 | $16,100 | $59,470 |
| 2021 | $3,314 | $75,570 | $16,100 | $59,470 |
| 2020 | $3,187 | $75,570 | $16,100 | $59,470 |
| 2019 | $2,921 | $68,600 | $14,630 | $53,970 |
| 2018 | $3,015 | $68,600 | $14,630 | $53,970 |
| 2017 | $2,914 | $68,600 | $14,630 | $53,970 |
| 2016 | $2,618 | $64,440 | $14,180 | $50,260 |
| 2014 | $2,573 | $64,440 | $14,180 | $50,260 |
| 2013 | $2,440 | $58,870 | $14,175 | $44,695 |
Source: Public Records
Map
Nearby Homes
- 115 Woodland Dr
- 405 Walnut St
- 636 Skodborg Dr
- 208 W High St
- 233 N Barron St
- 111 W High St
- 124 Deem St
- 331 W Chicago St
- 115 E Decatur St
- 125 E Decatur St
- 230 W Spring St
- 210 W Spring St
- 0-00 Washington Jackson Rd
- 219 E High St
- 612 N Cherry St
- 919 N Barron St
- 414 N Maple St
- 309 Liberty St
- 0 & 00 Washington Jackson Rd
- 105 Leatherman Place