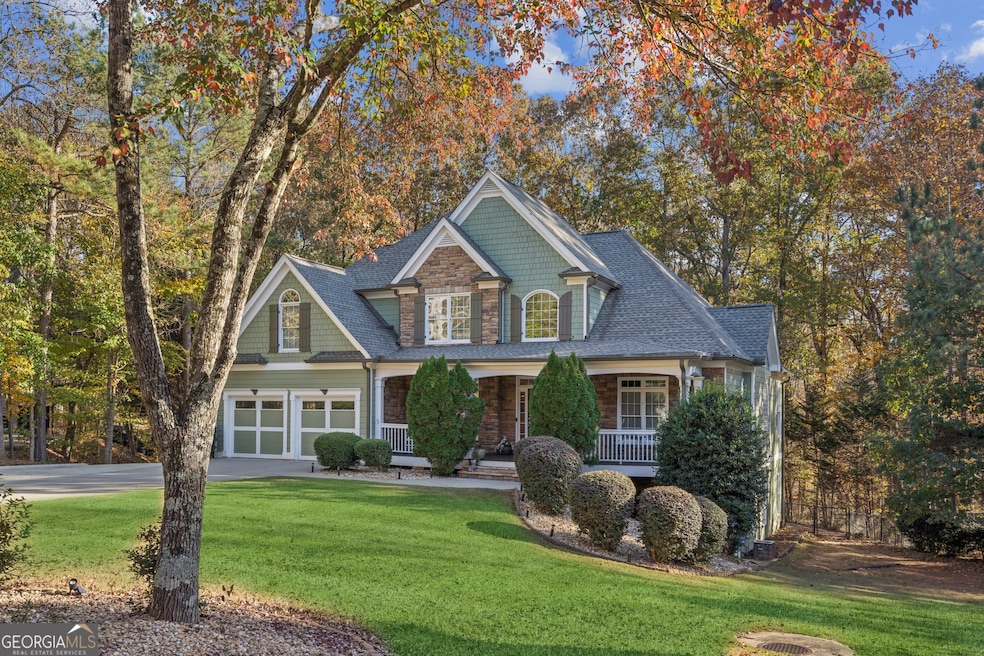
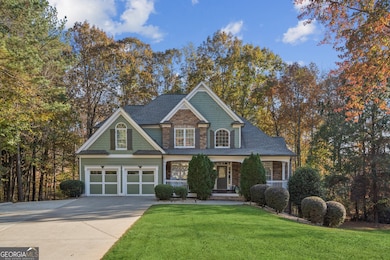
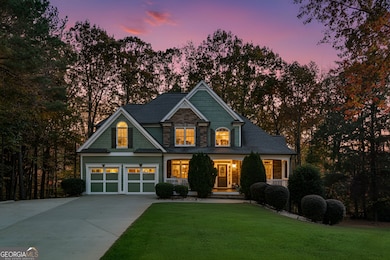
8160 Willow Point Gainesville, GA 30506
Lake Lanier NeighborhoodEstimated payment $3,426/month
Highlights
- Very Popular Property
- Home Theater
- Dining Room Seats More Than Twelve
- Chattahoochee Elementary School Rated A
- Craftsman Architecture
- Deck
About This Home
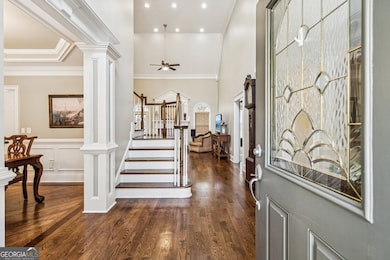
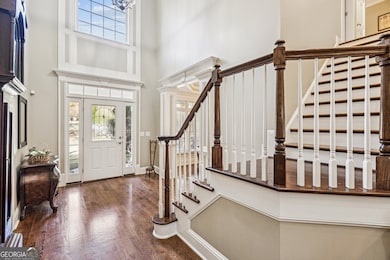
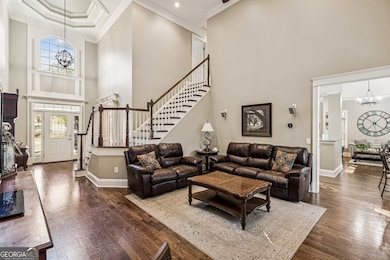
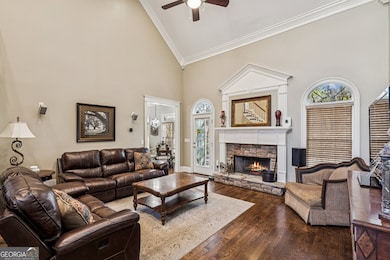
Beautifully designed 5 bedroom, 3.5 bath Craftsman-style home located just minutes from Lake Lanier! This stunning residence welcomes you with a two-story foyer featuring a triple trey ceiling that opens to a spacious great room perfect for entertaining or relaxing by the fire. The formal dining room showcases elegant inlaid wood floors and trey ceiling creating the perfect setting for gatherings. The updated kitchen boasts modern finishes and opens to a cozy keeping room making it the heart of the home. The primary suite on the main level offers convenience and comfort along with a main level laundry room just off the kitchen. Upstairs you'll find three additional bedrooms and a Jack and Jill bath providing plenty of space for family and guests. The finished terrace level is ideal for entertaining or multi-generational living featuring a large rec room with fireplace, theater room, bedroom, full bath, kitchenette, second laundry hook up and two spacious storages rooms. Enjoy the craftsmanship, space and versatility of this exceptional home. Schedule your private tour today and make this your new home for the holidays.
Listing Agent
Keller Williams Community Partners License #353196 Listed on: 11/14/2025

Home Details
Home Type
- Single Family
Est. Annual Taxes
- $973
Year Built
- Built in 2005
Lot Details
- 0.78 Acre Lot
- Cul-De-Sac
- Wooded Lot
HOA Fees
- $71 Monthly HOA Fees
Parking
- 2 Car Garage
Home Design
- Craftsman Architecture
- Composition Roof
Interior Spaces
- 2-Story Property
- Home Theater Equipment
- Tray Ceiling
- Vaulted Ceiling
- 2 Fireplaces
- Family Room
- Dining Room Seats More Than Twelve
- Home Theater
- Fire and Smoke Detector
- Laundry Room
Kitchen
- Microwave
- Dishwasher
- Kitchen Island
Flooring
- Wood
- Carpet
- Tile
Bedrooms and Bathrooms
- Walk-In Closet
- Double Vanity
Finished Basement
- Basement Fills Entire Space Under The House
- Exterior Basement Entry
- Fireplace in Basement
- Laundry in Basement
- Natural lighting in basement
Outdoor Features
- Deck
Schools
- Chattahoochee Elementary School
- Little Mill Middle School
- East Forsyth High School
Utilities
- Central Air
- Heating System Uses Natural Gas
- Underground Utilities
- 220 Volts
- Septic Tank
Community Details
Overview
- $846 Initiation Fee
- Association fees include tennis
- Northwalk Subdivision
Recreation
- Tennis Courts
- Community Pool
Map
Home Values in the Area
Average Home Value in this Area
Tax History
| Year | Tax Paid | Tax Assessment Tax Assessment Total Assessment is a certain percentage of the fair market value that is determined by local assessors to be the total taxable value of land and additions on the property. | Land | Improvement |
|---|---|---|---|---|
| 2025 | $973 | $204,820 | $48,000 | $156,820 |
| 2024 | $973 | $201,292 | $40,000 | $161,292 |
| 2023 | $864 | $189,752 | $34,000 | $155,752 |
| 2022 | $960 | $139,328 | $18,000 | $121,328 |
| 2021 | $943 | $139,328 | $18,000 | $121,328 |
| 2020 | $937 | $132,708 | $18,000 | $114,708 |
| 2019 | $937 | $127,728 | $14,000 | $113,728 |
| 2018 | $3,249 | $120,668 | $14,000 | $106,668 |
| 2017 | $3,080 | $114,112 | $14,000 | $100,112 |
| 2016 | $3,080 | $114,112 | $14,000 | $100,112 |
| 2015 | $3,085 | $114,112 | $14,000 | $100,112 |
| 2014 | $2,704 | $105,412 | $0 | $0 |
Property History
| Date | Event | Price | List to Sale | Price per Sq Ft |
|---|---|---|---|---|
| 11/14/2025 11/14/25 | For Sale | $620,000 | -- | $174 / Sq Ft |
Purchase History
| Date | Type | Sale Price | Title Company |
|---|---|---|---|
| Deed | $350,000 | -- | |
| Deed | $344,000 | -- | |
| Deed | $325,000 | -- |
Mortgage History
| Date | Status | Loan Amount | Loan Type |
|---|---|---|---|
| Open | $280,000 | New Conventional | |
| Previous Owner | $275,200 | New Conventional | |
| Previous Owner | $262,400 | New Conventional |
Source: Georgia MLS
MLS Number: 10638212
APN: 296-060
Disclaimer: Certain information contained herein is derived from information provided by parties other than Homes.com. All information provided is deemed reliable, but is not guaranteed to be accurate and should be independently verified.
![]() The data relating to real estate for sale on this web site comes in part from the Broker Reciprocity Program of Georgia MLS. Real estate listings held by brokerage firms other than Redfin are marked with the Broker Reciprocity logo and detailed information about them includes the name of the listing brokers. Information deemed reliable but not guaranteed. Copyright 2025 Georgia MLS. All rights reserved.
The data relating to real estate for sale on this web site comes in part from the Broker Reciprocity Program of Georgia MLS. Real estate listings held by brokerage firms other than Redfin are marked with the Broker Reciprocity logo and detailed information about them includes the name of the listing brokers. Information deemed reliable but not guaranteed. Copyright 2025 Georgia MLS. All rights reserved.
- 7985 Bethel Rd
- 7730 Bethel Rd
- 0000 Bethel Rd
- 00 Impala St
- 8365 Berringer Point Dr
- 9025 Belaire St
- 7845 Wilkinson Dr
- 8715 Bethel Rd
- 9240 Hollywood Dr
- 6375 Little Mill Rd
- 9355 Meadowbrook Dr
- 9135 Fox Trail Ln
- 7745 Timberline Overlook
- 6340 Barberry Hill Dr
- 9240 Lisa Cir
- 0 Lisa Cir Unit 7678520
- 0 Lisa Cir Unit 10640090
- 6635 Lawson Cir
- 8465 Bethel Ridge Ct
- 6535 Smith Cove Way
- 9195 Hannahs Crossing Dr
- 6345 Reives Rd
- 5380 Archer Ave
- 5100 Virginia Ave
- 5855 Shadewater Dr
- 7525 Harbour Walk
- 8320 Jensen Trail
- 8940 Bay Dr
- 8885 Bay Dr
- 3950 Chattahoochee Rd
- 8715 Covestone Dr
- 3915 Stone Creek Cir
- 6709 Wooded Cove Ct
- 4035 Lacey Dr
- 5505 Our Rd
- 6260 Cove Creek Dr
- 3840 Pilgrim Mill Rd
- 2650 Fairlane Dr