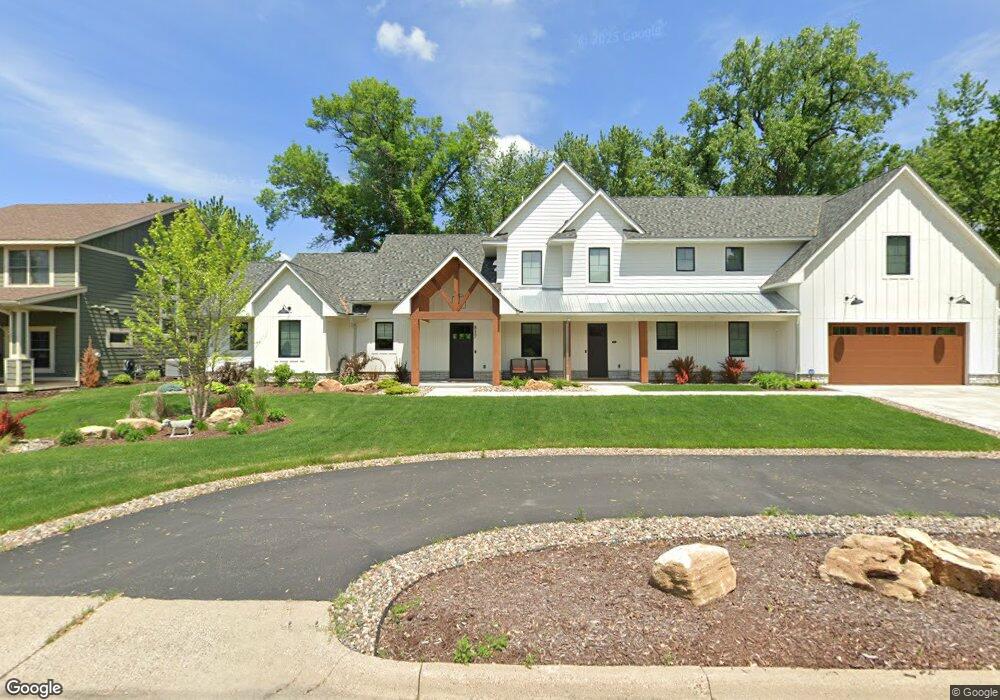
817 1st St E Hastings, MN 55033
Hastings-Marshan Township NeighborhoodEstimated Value: $552,000 - $962,000
3
Beds
2
Baths
1,570
Sq Ft
$488/Sq Ft
Est. Value
About This Home
This home is located at 817 1st St E, Hastings, MN 55033 and is currently estimated at $765,889, approximately $487 per square foot. 817 1st St E is a home located in Dakota County with nearby schools including Kennedy Elementary School, Hastings Middle School, and Hastings High School.
Ownership History
Date
Name
Owned For
Owner Type
Purchase Details
Closed on
Aug 3, 2022
Sold by
Machinery Consultants And Development I
Bought by
Francis Matthew and Francis Kelly
Current Estimated Value
Purchase Details
Closed on
Nov 18, 2015
Sold by
Team Anda Llc
Bought by
Machinery Consultants & Development Inc
Purchase Details
Closed on
Oct 16, 2014
Sold by
Blake Markedia L
Bought by
Team Anda Llc
Purchase Details
Closed on
Oct 30, 2007
Sold by
Litschke Henry J and Litschke Linda M
Bought by
Blake Markedia L
Create a Home Valuation Report for This Property
The Home Valuation Report is an in-depth analysis detailing your home's value as well as a comparison with similar homes in the area
Home Values in the Area
Average Home Value in this Area
Purchase History
| Date | Buyer | Sale Price | Title Company |
|---|---|---|---|
| Francis Matthew | $225,000 | -- | |
| Machinery Consultants & Development Inc | $277,000 | Burnet Title | |
| Team Anda Llc | $120,000 | Titlenexus Llc | |
| Blake Markedia L | $348,000 | -- |
Source: Public Records
Tax History
| Year | Tax Paid | Tax Assessment Tax Assessment Total Assessment is a certain percentage of the fair market value that is determined by local assessors to be the total taxable value of land and additions on the property. | Land | Improvement |
|---|---|---|---|---|
| 2024 | $4,458 | $839,200 | $201,700 | $637,500 |
| 2023 | $4,104 | $386,000 | $201,900 | $184,100 |
| 2022 | $3,806 | $365,700 | $218,300 | $147,400 |
| 2021 | $7,908 | $309,000 | $189,800 | $119,200 |
| 2020 | $3,734 | $295,600 | $180,800 | $114,800 |
| 2019 | $3,767 | $291,000 | $172,200 | $118,800 |
| 2018 | $3,675 | $278,600 | $164,000 | $114,600 |
| 2017 | $3,530 | $262,500 | $156,200 | $106,300 |
| 2016 | $3,695 | $250,800 | $145,900 | $104,900 |
| 2015 | $3,615 | $255,800 | $141,700 | $114,100 |
| 2014 | -- | $251,700 | $136,500 | $115,200 |
| 2013 | -- | $227,800 | $123,500 | $104,300 |
Source: Public Records
Map
Nearby Homes
Your Personal Tour Guide
Ask me questions while you tour the home.