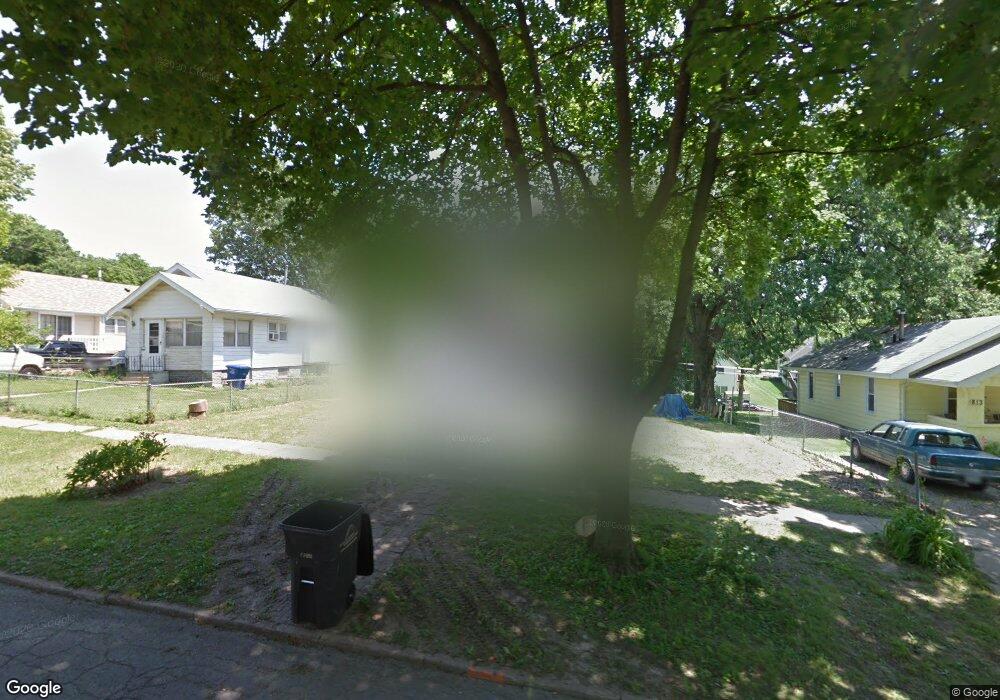
817 25th St Des Moines, IA 50312
Woodland Heights NeighborhoodEstimated Value: $68,707 - $187,000
1
Bed
2
Baths
480
Sq Ft
$262/Sq Ft
Est. Value
About This Home
This home is located at 817 25th St, Des Moines, IA 50312 and is currently estimated at $125,677, approximately $261 per square foot. 817 25th St is a home located in Polk County with nearby schools including Greenwood Elementary School, Callanan Middle School, and Roosevelt High School.
Ownership History
Date
Name
Owned For
Owner Type
Purchase Details
Closed on
Oct 30, 2013
Sold by
Liles Deborah and St John Pam
Bought by
Kuecker Christopher
Current Estimated Value
Purchase Details
Closed on
Jun 8, 2011
Sold by
0Hp 74 Lc
Bought by
Kuecker Christopher and Kuecker Christina
Purchase Details
Closed on
Sep 1, 2010
Sold by
Morning Star Mission Baptist Church
Bought by
Ohp 74 Lc
Purchase Details
Closed on
Dec 19, 2005
Sold by
Allen Robert W and Allen Dorothy M
Bought by
Morningstar Missionary Baptist Church
Create a Home Valuation Report for This Property
The Home Valuation Report is an in-depth analysis detailing your home's value as well as a comparison with similar homes in the area
Home Values in the Area
Average Home Value in this Area
Purchase History
| Date | Buyer | Sale Price | Title Company |
|---|---|---|---|
| Kuecker Christopher | -- | None Available | |
| Kuecker Christopher | $7,500 | None Available | |
| Ohp 74 Lc | $995 | None Available | |
| Morningstar Missionary Baptist Church | -- | None Available |
Source: Public Records
Tax History
| Year | Tax Paid | Tax Assessment Tax Assessment Total Assessment is a certain percentage of the fair market value that is determined by local assessors to be the total taxable value of land and additions on the property. | Land | Improvement |
|---|---|---|---|---|
| 2025 | $588 | $45,700 | $34,700 | $11,000 |
| 2024 | $588 | $40,400 | $30,600 | $9,800 |
| 2023 | $560 | $40,400 | $30,600 | $9,800 |
| 2022 | $552 | $32,600 | $24,900 | $7,700 |
| 2021 | $512 | $32,600 | $24,900 | $7,700 |
| 2020 | $526 | $29,100 | $22,300 | $6,800 |
| 2019 | $450 | $29,100 | $22,300 | $6,800 |
| 2018 | $442 | $25,300 | $19,400 | $5,900 |
| 2017 | $416 | $25,300 | $19,400 | $5,900 |
| 2016 | $400 | $23,900 | $18,300 | $5,600 |
| 2015 | $400 | $23,900 | $18,300 | $5,600 |
| 2014 | $328 | $21,700 | $16,600 | $5,100 |
Source: Public Records
Map
Nearby Homes
Your Personal Tour Guide
Ask me questions while you tour the home.