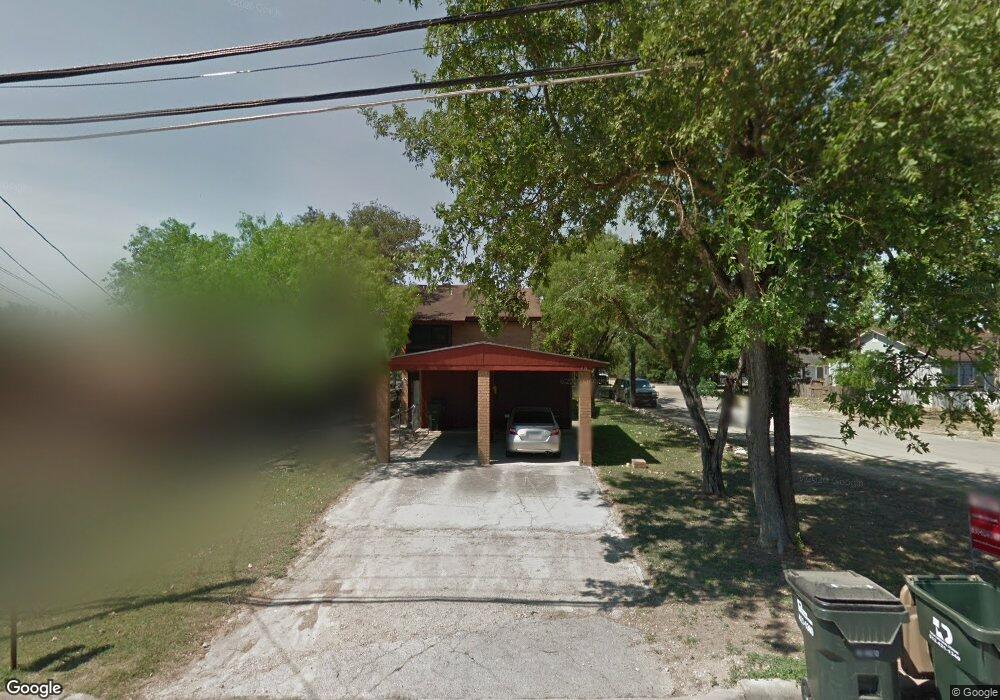
817 Allen St Unit 19 San Marcos, TX 78666
Southwest Hills NeighborhoodEstimated Value: $299,135 - $414,000
--
Bed
--
Bath
2,028
Sq Ft
$179/Sq Ft
Est. Value
About This Home
This home is located at 817 Allen St Unit 19, San Marcos, TX 78666 and is currently estimated at $362,784, approximately $178 per square foot. 817 Allen St Unit 19 is a home located in Hays County with nearby schools including Crockett Elementary School, Dorris Miller Middle School, and San Marcos High School.
Ownership History
Date
Name
Owned For
Owner Type
Purchase Details
Closed on
Apr 27, 2023
Sold by
Lesikar Melissa Elaine
Bought by
Cemel Properties Llc
Current Estimated Value
Purchase Details
Closed on
Sep 2, 2011
Sold by
Montet Barbara
Bought by
Lesikar Bruce and Lesikar Melissa E
Home Financials for this Owner
Home Financials are based on the most recent Mortgage that was taken out on this home.
Original Mortgage
$112,500
Interest Rate
4.53%
Mortgage Type
New Conventional
Create a Home Valuation Report for This Property
The Home Valuation Report is an in-depth analysis detailing your home's value as well as a comparison with similar homes in the area
Home Values in the Area
Average Home Value in this Area
Purchase History
| Date | Buyer | Sale Price | Title Company |
|---|---|---|---|
| Cemel Properties Llc | -- | None Listed On Document | |
| Lesikar Bruce | -- | Independence Title |
Source: Public Records
Mortgage History
| Date | Status | Borrower | Loan Amount |
|---|---|---|---|
| Previous Owner | Lesikar Bruce | $112,500 |
Source: Public Records
Tax History Compared to Growth
Tax History
| Year | Tax Paid | Tax Assessment Tax Assessment Total Assessment is a certain percentage of the fair market value that is determined by local assessors to be the total taxable value of land and additions on the property. | Land | Improvement |
|---|---|---|---|---|
| 2025 | $7,791 | $295,519 | $25,250 | $270,269 |
| 2024 | $7,791 | $395,860 | $25,250 | $370,610 |
| 2023 | $7,275 | $382,511 | $25,250 | $357,261 |
| 2022 | $6,604 | $322,264 | $21,400 | $300,864 |
| 2021 | $5,811 | $263,623 | $21,400 | $242,223 |
| 2020 | $5,287 | $239,893 | $21,400 | $218,493 |
| 2019 | $5,136 | $208,627 | $21,400 | $187,227 |
| 2018 | $3,836 | $155,110 | $21,400 | $133,710 |
| 2017 | $3,729 | $155,110 | $21,400 | $133,710 |
| 2016 | $3,511 | $146,020 | $21,400 | $124,620 |
| 2015 | $3,524 | $146,020 | $21,400 | $124,620 |
Source: Public Records
Map
Nearby Homes
- 800 N Bishop St
- 1000 Advance St
- 1000 Advance #2 St
- 1009 Advance St Unit 1011
- 1108 Marlton St
- 1007 Earle St
- 813 Bracewood Cir
- 809-811 Perkins St
- 335 Veramendi St
- 307 Quarry St
- 1222 W Hopkins St
- 833 Belvin St
- 102 Pitt St
- 821 Old Ranch Road 12
- 2007 Castle Gate Cir
- 1919 Castle Gate Cir
- 121 Scott St
- 2003 Lisa Ln
- 817 Allen St Unit 819
- 813 Allen St Unit 15
- 901/903 Allen St Unit 903
- 901/903 Allen St
- 901 Allen St Unit 903
- 809 Allen St Unit 11
- 903 Allen St Unit 903
- 1202/1204 Hillyer St
- 805-07 Allen St
- 1202 Hillyer St Unit 4
- 1204 Hillyer St
- 805 Allen St Unit 7
- 810 & 814 Allen St
- 810 Allen St Unit 14
- 905 Allen St Unit 907
- 1208 Hillyer St
- 907 Allen St
- 1206 Hillyer St Unit 8
- 1206/08 Hillyer
- 801 Allen St Unit 3