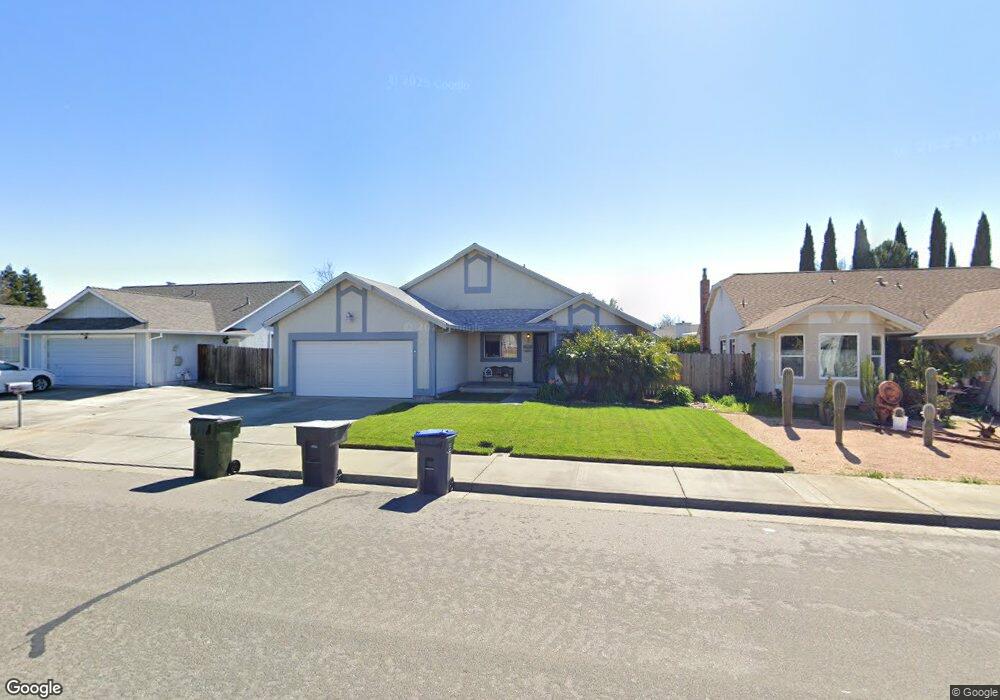
817 Capistrano Dr Suisun City, CA 94585
Estimated Value: $535,442 - $604,000
3
Beds
2
Baths
1,466
Sq Ft
$390/Sq Ft
Est. Value
About This Home
This home is located at 817 Capistrano Dr, Suisun City, CA 94585 and is currently estimated at $571,111, approximately $389 per square foot. 817 Capistrano Dr is a home located in Solano County with nearby schools including Dan O. Root Elementary School, Crystal Middle School, and Armijo High School.
Ownership History
Date
Name
Owned For
Owner Type
Purchase Details
Closed on
Sep 1, 1995
Sold by
Federal National Mortgage Association
Bought by
Galbreth Michael C and Galbreth Judy A
Current Estimated Value
Home Financials for this Owner
Home Financials are based on the most recent Mortgage that was taken out on this home.
Original Mortgage
$129,475
Interest Rate
7.97%
Purchase Details
Closed on
Feb 21, 1995
Sold by
Federal National Mortgage Association
Bought by
Federal National Mortgage Association
Purchase Details
Closed on
Aug 10, 1993
Sold by
Bright Mark A and Bright Cinthia C
Bought by
Bright Mark A and Bright Cinthia C
Home Financials for this Owner
Home Financials are based on the most recent Mortgage that was taken out on this home.
Original Mortgage
$15,000
Interest Rate
7.25%
Create a Home Valuation Report for This Property
The Home Valuation Report is an in-depth analysis detailing your home's value as well as a comparison with similar homes in the area
Home Values in the Area
Average Home Value in this Area
Purchase History
| Date | Buyer | Sale Price | Title Company |
|---|---|---|---|
| Galbreth Michael C | $133,500 | First American Title Guarant | |
| Federal National Mortgage Association | $130,500 | North American Title Company | |
| Bright Mark A | -- | -- |
Source: Public Records
Mortgage History
| Date | Status | Borrower | Loan Amount |
|---|---|---|---|
| Closed | Galbreth Michael C | $129,475 | |
| Previous Owner | Bright Mark A | $15,000 |
Source: Public Records
Tax History Compared to Growth
Tax History
| Year | Tax Paid | Tax Assessment Tax Assessment Total Assessment is a certain percentage of the fair market value that is determined by local assessors to be the total taxable value of land and additions on the property. | Land | Improvement |
|---|---|---|---|---|
| 2025 | $2,686 | $221,770 | $74,754 | $147,016 |
| 2024 | $2,686 | $217,423 | $73,289 | $144,134 |
| 2023 | $2,608 | $213,160 | $71,852 | $141,308 |
| 2022 | $2,577 | $208,982 | $70,444 | $138,538 |
| 2021 | $2,551 | $204,885 | $69,063 | $135,822 |
| 2020 | $2,495 | $202,785 | $68,355 | $134,430 |
| 2019 | $2,436 | $198,810 | $67,015 | $131,795 |
| 2018 | $2,529 | $194,912 | $65,701 | $129,211 |
| 2017 | $2,422 | $191,091 | $64,413 | $126,678 |
| 2016 | $2,451 | $187,345 | $63,150 | $124,195 |
| 2015 | $2,456 | $184,532 | $62,202 | $122,330 |
| 2014 | $2,439 | $180,918 | $60,984 | $119,934 |
Source: Public Records
Map
Nearby Homes
- 1201 Deanza Ct
- 1504 El Morro Ln
- 1651 Little Rock Cir
- 1416 Prospect Way
- 1756 Keesler Cir
- 1411 Klamath Dr
- 1415 Pelican Way
- 610 Placer Ln
- 819 Bluejay Dr
- 1203 Heron Dr
- 1109 Canary Dr
- 1621 Savannah Ln
- 2084 Parsons Dr
- 1665 Youngstown Ln
- 607 Crested Dr
- 51 Barcelona Cir
- 5 Belair Ct
- 1413 Spence Ct
- 189 Granada Dr
- 36 Segovia Dr
- 815 Capistrano Dr
- 819 Capistrano Dr
- 808 Bella Vista Dr
- 813 Capistrano Dr
- 803 Paseo Flores Ct
- 818 Capistrano Dr
- 805 Paseo Flores Ct
- 806 Bella Vista Dr
- 820 Capistrano Dr
- 816 Capistrano Dr
- 811 Capistrano Dr
- 756 Monte Carlo Dr
- 801 Paseo Flores Ct
- 804 Bella Vista Dr
- 807 Bella Vista Dr
- 804 Paseo Flores Ct
- 1522 Bella Vista Dr
- 809 Capistrano Dr
- 1214 Chula Vista Way
- 1527 Bella Vista Dr