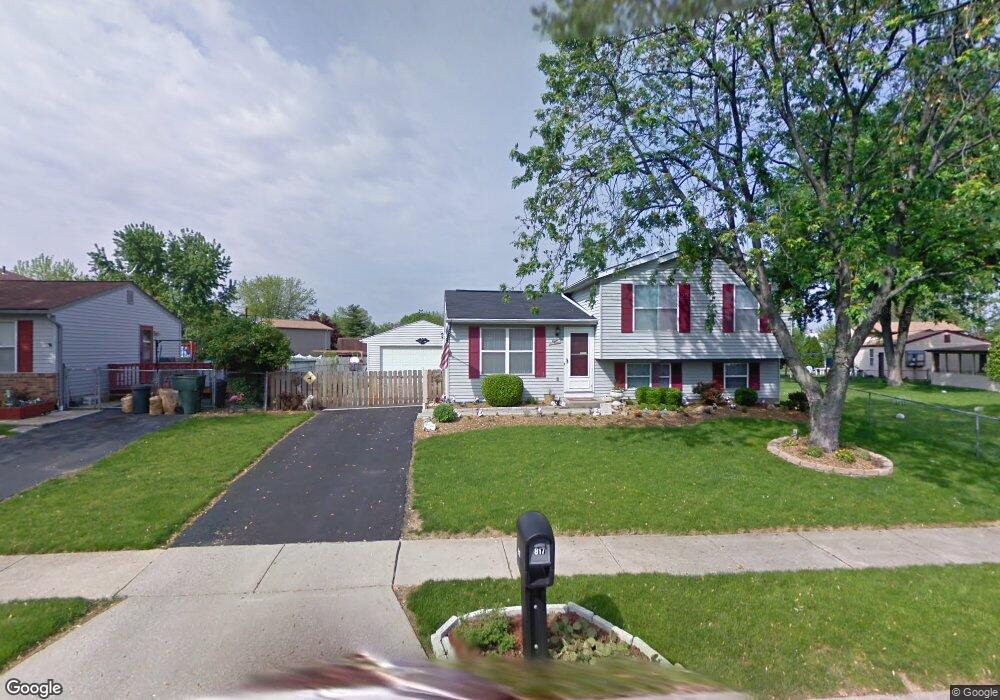
817 Cherryberry Dr Columbus, OH 43228
Cherry Creek NeighborhoodEstimated Value: $221,000 - $295,000
3
Beds
2
Baths
1,234
Sq Ft
$206/Sq Ft
Est. Value
About This Home
This home is located at 817 Cherryberry Dr, Columbus, OH 43228 and is currently estimated at $254,418, approximately $206 per square foot. 817 Cherryberry Dr is a home located in Franklin County with nearby schools including Prairie Norton Elementary School, Holt Crossing Intermediate School, and Pleasant View Middle School.
Ownership History
Date
Name
Owned For
Owner Type
Purchase Details
Closed on
Apr 24, 2017
Sold by
Hill Chelsie and Us Bank Na
Bought by
Wwsd Llc
Current Estimated Value
Purchase Details
Closed on
Aug 27, 2010
Sold by
Traugh R Michael and Traugh Diane P
Bought by
Hill Chelsie
Home Financials for this Owner
Home Financials are based on the most recent Mortgage that was taken out on this home.
Original Mortgage
$98,671
Interest Rate
5.25%
Mortgage Type
FHA
Purchase Details
Closed on
May 10, 2007
Sold by
Sfjv 2005 Llc
Bought by
Traugh R Michael and Traugh Diane P
Home Financials for this Owner
Home Financials are based on the most recent Mortgage that was taken out on this home.
Original Mortgage
$93,000
Interest Rate
9%
Mortgage Type
Purchase Money Mortgage
Purchase Details
Closed on
Aug 7, 2006
Sold by
Clark Karen J and Wells Fargo Bank Na
Bought by
Sfjv 2005 Llc
Purchase Details
Closed on
Jan 27, 1993
Purchase Details
Closed on
Nov 4, 1987
Create a Home Valuation Report for This Property
The Home Valuation Report is an in-depth analysis detailing your home's value as well as a comparison with similar homes in the area
Home Values in the Area
Average Home Value in this Area
Purchase History
| Date | Buyer | Sale Price | Title Company |
|---|---|---|---|
| Wwsd Llc | $75,000 | None Available | |
| Hill Chelsie | $100,000 | Talon Group | |
| Traugh R Michael | $93,000 | Rels Title | |
| Sfjv 2005 Llc | $80,000 | None Available | |
| -- | $70,000 | -- | |
| -- | $56,500 | -- |
Source: Public Records
Mortgage History
| Date | Status | Borrower | Loan Amount |
|---|---|---|---|
| Previous Owner | Hill Chelsie | $98,671 | |
| Previous Owner | Traugh R Michael | $93,000 |
Source: Public Records
Tax History
| Year | Tax Paid | Tax Assessment Tax Assessment Total Assessment is a certain percentage of the fair market value that is determined by local assessors to be the total taxable value of land and additions on the property. | Land | Improvement |
|---|---|---|---|---|
| 2025 | $2,721 | $72,770 | $24,050 | $48,720 |
| 2024 | $2,721 | $72,770 | $24,050 | $48,720 |
| 2023 | $2,830 | $72,770 | $24,050 | $48,720 |
| 2022 | $1,870 | $37,350 | $9,100 | $28,250 |
| 2021 | $2,484 | $37,350 | $9,100 | $28,250 |
| 2020 | $1,898 | $37,350 | $9,100 | $28,250 |
| 2019 | $1,791 | $31,080 | $7,560 | $23,520 |
| 2018 | $1,907 | $31,080 | $7,560 | $23,520 |
| 2017 | $1,870 | $32,200 | $7,560 | $24,640 |
| 2016 | $2,145 | $31,090 | $6,550 | $24,540 |
| 2015 | $1,996 | $31,090 | $6,550 | $24,540 |
| 2014 | $1,883 | $31,090 | $6,550 | $24,540 |
| 2013 | $983 | $32,725 | $6,895 | $25,830 |
Source: Public Records
Map
Nearby Homes
- 4848 Deephollow Dr
- 470 Woodlawn Ave
- 495 Daytona Rd
- 400 Evergreen Terrace
- 429 Postle Blvd
- 546 Emmit Ave
- 531 Emmit Ave
- 354 Fernhill Ave
- 557 Simbury St
- 352 Postle Blvd
- 671 Simbury St
- 621 Simbury St Unit D6
- 496 Clairbrook Ave Unit Jc-13
- 634 Dlyn St Unit 5
- 443 Clairbrook Ave
- 660 Dlyn St
- 614 Dlyn St
- 4518 Hall Rd
- 575 Dlyn St
- 5584 Brackenridge Ave Unit R7
- 823 Cherryberry Dr
- 5075 Cherry Creek
- 5075 Cherry Creek Pkwy S
- 824 Ginger Willow Ct
- 5097 Cherry Creek Pkwy S
- 835 Cherryberry Dr
- 832 Ginger Willow Ct
- 5115 Cherry Creek
- 5115 Cherry Creek Pkwy S
- 817 Ginger Willow Ct
- 5031 Cherry Creek Pkwy S
- 5031 Cherry Creek
- 843 Cherryberry Dr
- 818 Cherryberry Dr
- 812 Cherryberry Dr
- 826 Cherryberry Dr
- 840 Ginger Willow Ct
- 851 Cherryberry Dr
- 5133 S Cherry Creek
- 5133 Cherry Creek
Your Personal Tour Guide
Ask me questions while you tour the home.