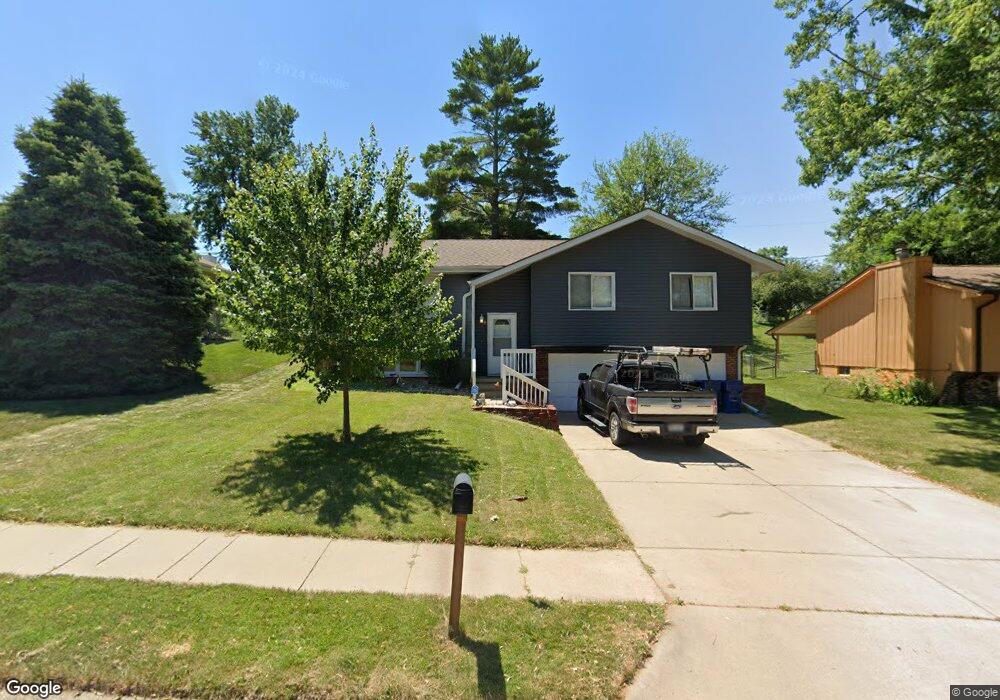
817 Crest Dr Papillion, NE 68046
Estimated Value: $246,399 - $271,000
3
Beds
2
Baths
1,128
Sq Ft
$232/Sq Ft
Est. Value
About This Home
This home is located at 817 Crest Dr, Papillion, NE 68046 and is currently estimated at $262,100, approximately $232 per square foot. 817 Crest Dr is a home located in Sarpy County with nearby schools including Carriage Hill Elementary School, Papillion Middle School, and Papillion La Vista South High School.
Ownership History
Date
Name
Owned For
Owner Type
Purchase Details
Closed on
Aug 27, 2015
Sold by
Castillo Hernandez Jose L and Rothlisberger Julie
Bought by
Carrizal Properties Llc
Current Estimated Value
Purchase Details
Closed on
Sep 29, 2008
Sold by
Rothlisberger Donna and Donna Rothlisberger Revocable
Bought by
Rothlisberger Keith and Rothlisberger Linda
Purchase Details
Closed on
Sep 27, 2005
Sold by
Rothlisberger Jeffrey K and Rothlisberger Donna
Bought by
Rothlisberger Donna and The Donna Rothlisberger Revocable Trust
Purchase Details
Closed on
Sep 12, 2000
Sold by
Hoeschen and Julie
Bought by
Rothlisberger Jeffrey K
Purchase Details
Closed on
Sep 3, 1992
Sold by
Schaum Debbie M
Bought by
Hoeschen Gerard and Hoeschen Julie
Home Financials for this Owner
Home Financials are based on the most recent Mortgage that was taken out on this home.
Original Mortgage
$65,000
Interest Rate
7.04%
Create a Home Valuation Report for This Property
The Home Valuation Report is an in-depth analysis detailing your home's value as well as a comparison with similar homes in the area
Home Values in the Area
Average Home Value in this Area
Purchase History
| Date | Buyer | Sale Price | Title Company |
|---|---|---|---|
| Carrizal Properties Llc | -- | None Available | |
| Rothlisberger Keith | -- | None Available | |
| Rothlisberger Donna | -- | -- | |
| Rothlisberger Jeffrey K | $85,000 | -- | |
| Hoeschen Gerard | $65,000 | -- |
Source: Public Records
Mortgage History
| Date | Status | Borrower | Loan Amount |
|---|---|---|---|
| Previous Owner | Hoeschen Gerard | $65,000 |
Source: Public Records
Tax History
| Year | Tax Paid | Tax Assessment Tax Assessment Total Assessment is a certain percentage of the fair market value that is determined by local assessors to be the total taxable value of land and additions on the property. | Land | Improvement |
|---|---|---|---|---|
| 2025 | $3,354 | $238,401 | $45,000 | $193,401 |
| 2024 | $3,876 | $224,864 | $40,000 | $184,864 |
| 2023 | $3,876 | $205,827 | $40,000 | $165,827 |
| 2022 | $3,763 | $184,382 | $35,000 | $149,382 |
| 2021 | $3,520 | $169,074 | $30,000 | $139,074 |
| 2020 | $3,216 | $152,924 | $29,000 | $123,924 |
| 2019 | $3,135 | $149,171 | $29,000 | $120,171 |
| 2018 | $2,886 | $135,233 | $22,000 | $113,233 |
| 2017 | $2,666 | $124,948 | $22,000 | $102,948 |
| 2016 | $2,588 | $121,519 | $22,000 | $99,519 |
| 2015 | $2,463 | $115,961 | $22,000 | $93,961 |
| 2014 | $2,478 | $115,891 | $22,000 | $93,891 |
| 2012 | -- | $118,215 | $22,000 | $96,215 |
Source: Public Records
Map
Nearby Homes
- 1113 Hackney Dr
- 1114 Hackney Dr
- 921 Arlene Cir
- 1107 Patricia Dr
- 1021 Patricia Dr
- 1101 Patricia Dr
- 1005 Patricia Dr
- 1009 Patricia Dr
- 1103 Patricia Dr
- 1017 Patricia Dr
- 1019 Patricia Dr
- 1023 Patricia Dr
- 1011 Patricia Dr
- 1003 Patricia Dr
- 1007 Patricia Dr
- 1015 Patricia Dr
- 1013 Patricia Dr
- 1001 Patricia Dr
- 1120 Delmar St Unit 4B
- 1120 Delmar St Unit 5B
Your Personal Tour Guide
Ask me questions while you tour the home.