Estimated Value: $246,656 - $311,000
--
Bed
2
Baths
1,967
Sq Ft
$140/Sq Ft
Est. Value
About This Home
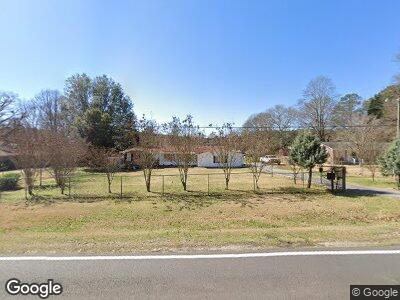
This home is located at 817 Glenn Carrie Rd, Hull, GA 30646 and is currently estimated at $274,664, approximately $139 per square foot. 817 Glenn Carrie Rd is a home located in Madison County with nearby schools including Madison County High School.
Ownership History
Date
Name
Owned For
Owner Type
Purchase Details
Closed on
May 29, 2020
Sold by
Flores Denis A Heredia
Bought by
Lemus Liliana E
Current Estimated Value
Home Financials for this Owner
Home Financials are based on the most recent Mortgage that was taken out on this home.
Original Mortgage
$107,200
Outstanding Balance
$96,274
Interest Rate
3.2%
Mortgage Type
New Conventional
Estimated Equity
$159,394
Purchase Details
Closed on
Apr 1, 2016
Sold by
Melton Wayne Charles
Bought by
Flores Denis A and Flores Heredia
Home Financials for this Owner
Home Financials are based on the most recent Mortgage that was taken out on this home.
Original Mortgage
$101,035
Interest Rate
4.12%
Mortgage Type
FHA
Purchase Details
Closed on
May 1, 2015
Sold by
Melton Una Faye
Bought by
Melton Wayne Charles
Purchase Details
Closed on
Jan 1, 1976
Sold by
Melton Charles E
Bought by
Melton Una Faye
Create a Home Valuation Report for This Property
The Home Valuation Report is an in-depth analysis detailing your home's value as well as a comparison with similar homes in the area
Home Values in the Area
Average Home Value in this Area
Purchase History
| Date | Buyer | Sale Price | Title Company |
|---|---|---|---|
| Lemus Liliana E | $134,000 | -- | |
| Flores Denis A | $102,900 | -- | |
| Melton Wayne Charles | -- | -- | |
| Melton Una Faye | -- | -- |
Source: Public Records
Mortgage History
| Date | Status | Borrower | Loan Amount |
|---|---|---|---|
| Open | Lemus Liliana E | $107,200 | |
| Previous Owner | Flores Denis A | $101,035 |
Source: Public Records
Tax History Compared to Growth
Tax History
| Year | Tax Paid | Tax Assessment Tax Assessment Total Assessment is a certain percentage of the fair market value that is determined by local assessors to be the total taxable value of land and additions on the property. | Land | Improvement |
|---|---|---|---|---|
| 2024 | $2,381 | $93,471 | $15,360 | $78,111 |
| 2023 | $2,704 | $88,562 | $15,360 | $73,202 |
| 2022 | $2,169 | $80,647 | $15,360 | $65,287 |
| 2021 | $1,636 | $60,409 | $12,800 | $47,609 |
| 2020 | $1,796 | $58,426 | $12,800 | $45,626 |
| 2019 | $1,579 | $50,783 | $8,000 | $42,783 |
| 2018 | $1,551 | $49,738 | $8,000 | $41,738 |
| 2017 | $1,311 | $45,530 | $8,000 | $37,530 |
| 2016 | $948 | $33,020 | $8,000 | $25,020 |
| 2015 | $588 | $30,518 | $8,000 | $22,518 |
| 2014 | $685 | $33,800 | $8,000 | $25,800 |
| 2013 | -- | $33,800 | $8,000 | $25,800 |
Source: Public Records
Map
Nearby Homes
- 0 Woodland Creek Place Unit 10421130
- 181 Bedford Dr
- 685 Bedford Dr
- 68 Arthur Rd
- 298 Kylas Way
- 230 Glen Meadow Ct
- 186 Ivywood Dr
- 175 Woodbury Ln
- 0 Highway 29 S Unit 10475312
- 0 Highway 29 S Unit 1024268
- 98 Woodbury Ln
- 190 Briarwood Ln
- 220 Sing Tree Ln
- 1070 Spratlin Mill Dr
- 1020 Spratlin Mill Dr
- 8986 Highway 29 S
- 111 Lee Dr
- 4025 Danielsville Rd
- 817 Glenn Carrie Rd
- 789 Glenn Carrie Rd
- 841 Glenn Carrie Rd
- 765 Glenn Carrie Rd
- 1055 Virginia Ln
- 1085 Virginia Ln
- 1057 Virginia Ln
- 1031 Virginia Ln
- 768 Glenn Carrie Rd
- 804 Glenn Carrie Rd
- 1101 Virginia Ln
- 881 Glenn Carrie Rd
- 840 Glenn Carrie Rd
- 1019 Virginia Ln
- 745 Glenn Carrie Rd
- 1133 Virginia Ln
- 864 Glenn Carrie Rd
- 915 Glenn Carrie Rd
- 1163 Virginia Ln
- 900 Glenn Carrie Rd