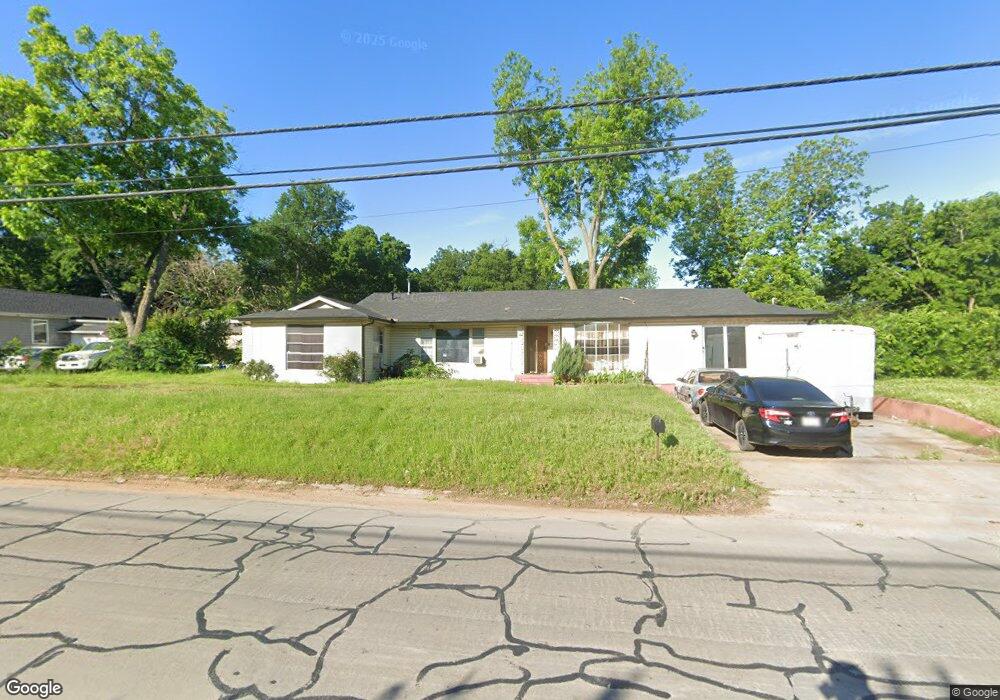
817 Granbury St Cleburne, TX 76033
Estimated Value: $252,000 - $286,000
4
Beds
2
Baths
2,468
Sq Ft
$109/Sq Ft
Est. Value
About This Home
This home is located at 817 Granbury St, Cleburne, TX 76033 and is currently estimated at $268,122, approximately $108 per square foot. 817 Granbury St is a home located in Johnson County with nearby schools including Cooke Elementary School, A.D. Wheat Middle School, and Cleburne High School.
Ownership History
Date
Name
Owned For
Owner Type
Purchase Details
Closed on
Apr 1, 2017
Sold by
Duggerfam Investments Llc
Bought by
Duggerfam Investments Llc
Current Estimated Value
Home Financials for this Owner
Home Financials are based on the most recent Mortgage that was taken out on this home.
Original Mortgage
$79,000
Outstanding Balance
$40,673
Interest Rate
4.1%
Mortgage Type
Purchase Money Mortgage
Estimated Equity
$227,449
Purchase Details
Closed on
Sep 8, 2010
Sold by
Aguirre Evangelina
Bought by
Pennymac Loan Services Llc
Create a Home Valuation Report for This Property
The Home Valuation Report is an in-depth analysis detailing your home's value as well as a comparison with similar homes in the area
Home Values in the Area
Average Home Value in this Area
Purchase History
| Date | Buyer | Sale Price | Title Company |
|---|---|---|---|
| Duggerfam Investments Llc | -- | None Available | |
| Duggerfan Investments Llc | -- | None Available | |
| Pennymac Loan Services Llc | $59,364 | None Available |
Source: Public Records
Mortgage History
| Date | Status | Borrower | Loan Amount |
|---|---|---|---|
| Open | Duggerfan Investments Llc | $79,000 | |
| Closed | Duggerfam Investments Llc | $79,000 |
Source: Public Records
Tax History Compared to Growth
Tax History
| Year | Tax Paid | Tax Assessment Tax Assessment Total Assessment is a certain percentage of the fair market value that is determined by local assessors to be the total taxable value of land and additions on the property. | Land | Improvement |
|---|---|---|---|---|
| 2025 | $2,114 | $154,731 | $39,000 | $115,731 |
| 2024 | $3,450 | $154,731 | $39,000 | $115,731 |
| 2023 | $2,105 | $154,231 | $38,500 | $115,731 |
| 2022 | $3,507 | $145,231 | $29,500 | $115,731 |
| 2021 | $3,324 | $145,231 | $29,500 | $115,731 |
| 2020 | $3,209 | $135,731 | $20,000 | $115,731 |
| 2019 | $3,111 | $135,731 | $20,000 | $115,731 |
| 2018 | $2,829 | $95,710 | $28,000 | $67,710 |
| 2017 | $2,817 | $95,710 | $28,000 | $67,710 |
| 2016 | $2,502 | $84,983 | $13,500 | $71,483 |
| 2015 | $2,265 | $84,983 | $13,500 | $71,483 |
| 2014 | $2,265 | $84,983 | $13,500 | $71,483 |
Source: Public Records
Map
Nearby Homes
- 107 Woodard Ave
- 618 Granbury St
- 704 Graham St
- 1103 N Walnut St
- 104 Dixon St
- 807 Poindexter Ave
- 701 Poindexter Ave
- 800 Madison St
- 702 N Walnut St
- 607 N Wood St
- 916 Poindexter Ave
- 1204 N Wood St
- 106 Glen Rose Ave
- 312 N Wood St
- 1006 Princeton Place
- 502 Bales St
- 1307 Joslin St
- 922 N Buffalo Ave
- 709 N Buffalo Ave
- 308 Poindexter Ave