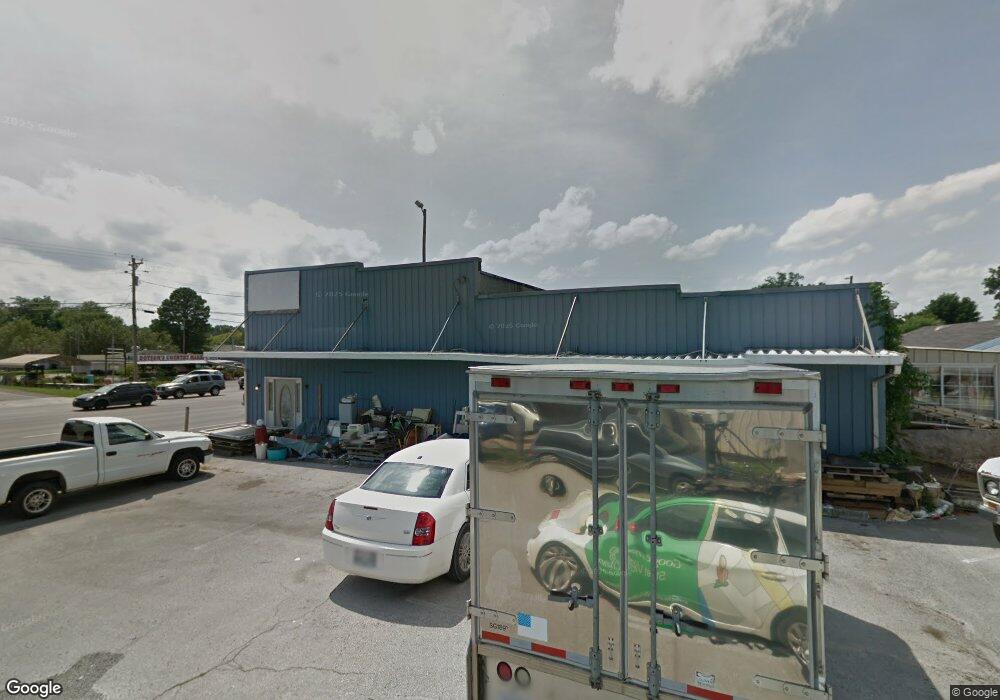
817 Hillsboro Blvd Manchester, TN 37355
Estimated Value: $198,298
--
Bed
1
Bath
1,590
Sq Ft
$125/Sq Ft
Est. Value
About This Home
This home is located at 817 Hillsboro Blvd, Manchester, TN 37355 and is currently estimated at $198,298, approximately $124 per square foot. 817 Hillsboro Blvd is a home located in Coffee County with nearby schools including Westwood Middle School and Temple Baptist Christian School.
Ownership History
Date
Name
Owned For
Owner Type
Purchase Details
Closed on
Jul 23, 2021
Sold by
Cox Charles T and Cox Bobbie
Bought by
Foster John Gavin
Current Estimated Value
Home Financials for this Owner
Home Financials are based on the most recent Mortgage that was taken out on this home.
Original Mortgage
$100,000
Outstanding Balance
$90,818
Interest Rate
2.96%
Mortgage Type
Seller Take Back
Estimated Equity
$107,480
Purchase Details
Closed on
May 7, 2020
Sold by
Cox Charles Thomas and Cox Bobbie D
Bought by
Cox Charles Thomas and Cox Bobbie D
Purchase Details
Closed on
Feb 21, 2007
Sold by
Abbott Craig
Bought by
Cox Charles T
Purchase Details
Closed on
Sep 20, 1991
Bought by
Abbott Craig & Jere Garland
Purchase Details
Closed on
Aug 12, 1986
Bought by
Stephens Donald E
Create a Home Valuation Report for This Property
The Home Valuation Report is an in-depth analysis detailing your home's value as well as a comparison with similar homes in the area
Home Values in the Area
Average Home Value in this Area
Purchase History
| Date | Buyer | Sale Price | Title Company |
|---|---|---|---|
| Foster John Gavin | $150,000 | None Available | |
| Cox Charles Thomas | -- | None Available | |
| Cox Charles T | $115,000 | -- | |
| Abbott Craig & Jere Garland | $34,000 | -- | |
| Stephens Donald E | $20,000 | -- |
Source: Public Records
Mortgage History
| Date | Status | Borrower | Loan Amount |
|---|---|---|---|
| Open | Foster John Gavin | $100,000 |
Source: Public Records
Tax History Compared to Growth
Tax History
| Year | Tax Paid | Tax Assessment Tax Assessment Total Assessment is a certain percentage of the fair market value that is determined by local assessors to be the total taxable value of land and additions on the property. | Land | Improvement |
|---|---|---|---|---|
| 2024 | $2,486 | $58,960 | $20,000 | $38,960 |
| 2023 | $2,486 | $58,960 | $0 | $0 |
| 2022 | $2,140 | $58,960 | $20,000 | $38,960 |
| 2021 | $2,122 | $46,320 | $16,400 | $29,920 |
| 2020 | $2,122 | $46,320 | $16,400 | $29,920 |
| 2019 | $2,122 | $46,320 | $16,400 | $29,920 |
| 2018 | $2,122 | $46,320 | $16,400 | $29,920 |
| 2017 | $2,375 | $45,280 | $12,000 | $33,280 |
| 2016 | $2,375 | $45,280 | $12,000 | $33,280 |
| 2015 | $2,375 | $45,280 | $12,000 | $33,280 |
| 2014 | $2,375 | $45,277 | $0 | $0 |
Source: Public Records
Map
Nearby Homes