Estimated Value: $2,181,000 - $4,327,062
3
Beds
4
Baths
4,320
Sq Ft
$819/Sq Ft
Est. Value
About This Home
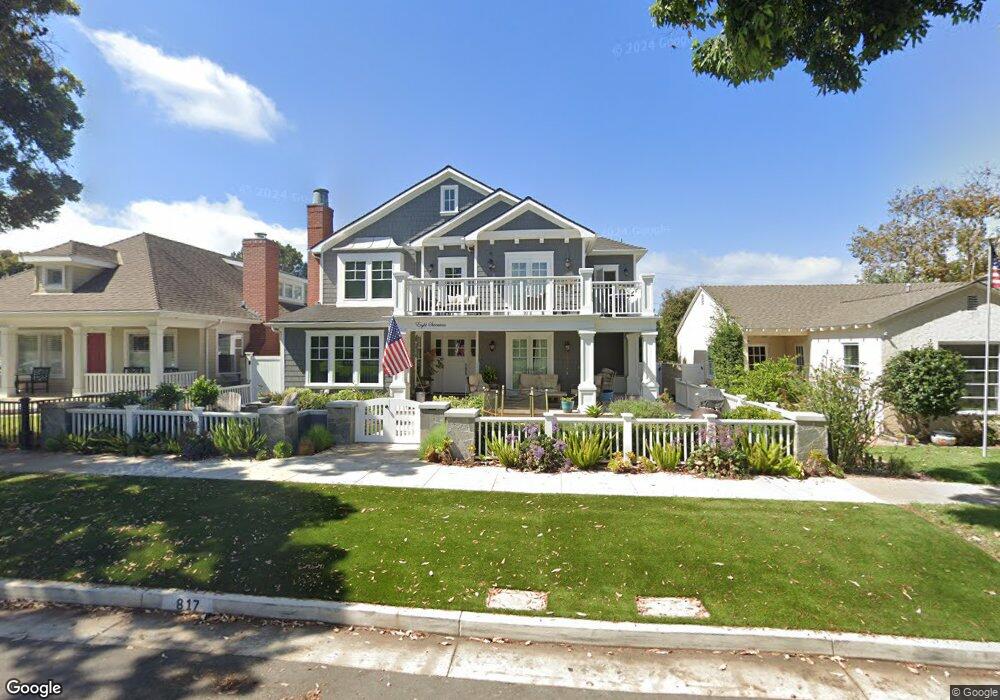
This home is located at 817 Main St, Huntington Beach, CA 92648 and is currently estimated at $3,537,766, approximately $818 per square foot. 817 Main St is a home located in Orange County with nearby schools including Agnes L. Smith Elementary, Ethel Dwyer Middle, and Huntington Beach High School.
Ownership History
Date
Name
Owned For
Owner Type
Purchase Details
Closed on
Oct 15, 2019
Sold by
Weisenburg Wilson Tharpe and Weisenburg Lori Gelalich
Bought by
Weisenburg Wilson T and Weisenburg Lori Lee G
Current Estimated Value
Purchase Details
Closed on
Mar 17, 2005
Sold by
Park Center Exchange Inc
Bought by
Weisenburg Wilson Tharpe and Weisenburg Lori Gelalich
Home Financials for this Owner
Home Financials are based on the most recent Mortgage that was taken out on this home.
Original Mortgage
$815,000
Outstanding Balance
$433,802
Interest Rate
6.37%
Mortgage Type
Purchase Money Mortgage
Estimated Equity
$3,103,964
Purchase Details
Closed on
Mar 16, 2005
Sold by
Hagman Judith Michelle
Bought by
Hagman Preston B and Hagman Judith Michelle
Home Financials for this Owner
Home Financials are based on the most recent Mortgage that was taken out on this home.
Original Mortgage
$815,000
Outstanding Balance
$433,802
Interest Rate
6.37%
Mortgage Type
Purchase Money Mortgage
Estimated Equity
$3,103,964
Purchase Details
Closed on
Feb 22, 2005
Sold by
Hagman Preston B and Hagman Judith Michelle
Bought by
Park Center Exchange Inc
Home Financials for this Owner
Home Financials are based on the most recent Mortgage that was taken out on this home.
Original Mortgage
$815,000
Outstanding Balance
$433,802
Interest Rate
6.37%
Mortgage Type
Purchase Money Mortgage
Estimated Equity
$3,103,964
Purchase Details
Closed on
Mar 2, 2000
Sold by
Hagman and Judith
Bought by
Hagman Judith Michelle
Home Financials for this Owner
Home Financials are based on the most recent Mortgage that was taken out on this home.
Original Mortgage
$250,000
Interest Rate
4.95%
Mortgage Type
Purchase Money Mortgage
Purchase Details
Closed on
May 29, 1998
Sold by
Preston Hagman and Preston Michelle Judith
Bought by
Hagman Preston and Michelle Hagman J
Purchase Details
Closed on
Mar 14, 1998
Sold by
Preston Hagman
Bought by
Hagman Preston and Hagman Judith Michelle
Home Financials for this Owner
Home Financials are based on the most recent Mortgage that was taken out on this home.
Original Mortgage
$150,000
Interest Rate
7.02%
Mortgage Type
Purchase Money Mortgage
Create a Home Valuation Report for This Property
The Home Valuation Report is an in-depth analysis detailing your home's value as well as a comparison with similar homes in the area
Home Values in the Area
Average Home Value in this Area
Purchase History
| Date | Buyer | Sale Price | Title Company |
|---|---|---|---|
| Weisenburg Wilson T | -- | None Available | |
| Weisenburg Wilson Tharpe | $1,258,500 | Chicago Title | |
| Hagman Preston B | -- | Chicago Title | |
| Park Center Exchange Inc | -- | Chicago Title | |
| Hagman Judith Michelle | -- | American Title Co | |
| Hagman Preston | -- | -- | |
| Hagman Preston | -- | Old Republic Title Company |
Source: Public Records
Mortgage History
| Date | Status | Borrower | Loan Amount |
|---|---|---|---|
| Open | Weisenburg Wilson Tharpe | $815,000 | |
| Previous Owner | Hagman Judith Michelle | $250,000 | |
| Previous Owner | Hagman Preston | $150,000 |
Source: Public Records
Tax History Compared to Growth
Tax History
| Year | Tax Paid | Tax Assessment Tax Assessment Total Assessment is a certain percentage of the fair market value that is determined by local assessors to be the total taxable value of land and additions on the property. | Land | Improvement |
|---|---|---|---|---|
| 2025 | $28,950 | $2,635,363 | $1,643,173 | $992,190 |
| 2024 | $28,950 | $2,583,690 | $1,610,954 | $972,736 |
| 2023 | $23,416 | $2,088,082 | $1,144,197 | $943,885 |
| 2022 | $22,805 | $2,047,140 | $1,121,762 | $925,378 |
| 2021 | $22,378 | $2,007,000 | $1,099,766 | $907,234 |
| 2020 | $20,847 | $1,860,021 | $952,787 | $907,234 |
| 2019 | $19,232 | $1,700,626 | $934,105 | $766,521 |
| 2018 | $12,076 | $1,049,998 | $915,790 | $134,208 |
| 2017 | $11,385 | $982,000 | $897,834 | $84,166 |
| 2016 | $10,389 | $929,969 | $845,803 | $84,166 |
| 2015 | $10,367 | $916,000 | $833,098 | $82,902 |
| 2014 | $9,386 | $828,076 | $745,174 | $82,902 |
Source: Public Records
Map
Nearby Homes