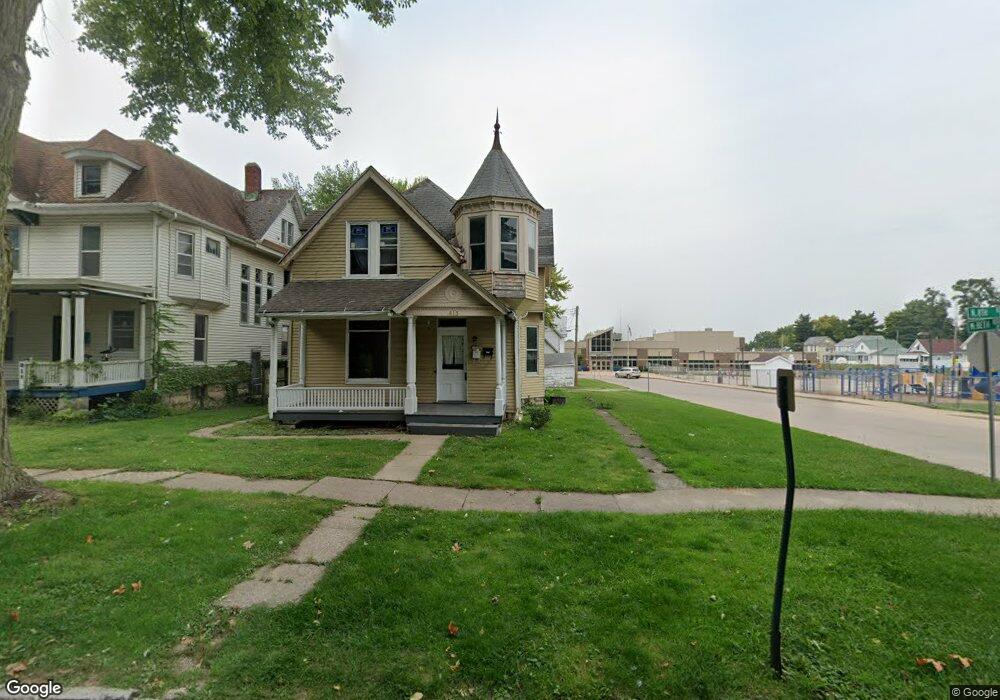
817 N 8th St Burlington, IA 52601
Estimated Value: $57,000 - $101,000
4
Beds
3
Baths
2,272
Sq Ft
$36/Sq Ft
Est. Value
About This Home
This home is located at 817 N 8th St, Burlington, IA 52601 and is currently estimated at $81,333, approximately $35 per square foot. 817 N 8th St is a home located in Des Moines County with nearby schools including Burlington Community High School, Great River Christian School, and Burlington Christian School.
Ownership History
Date
Name
Owned For
Owner Type
Purchase Details
Closed on
Nov 2, 2015
Sold by
Us Bank Na
Bought by
Secretary Of Hud
Current Estimated Value
Purchase Details
Closed on
Sep 20, 2012
Sold by
Mcclellon Robert L and Mcclellon Robert L
Bought by
Us Bank Na
Purchase Details
Closed on
Jan 21, 2009
Sold by
Trosen Raymond and Trosen Martha L
Bought by
Mclellon Robert L
Home Financials for this Owner
Home Financials are based on the most recent Mortgage that was taken out on this home.
Original Mortgage
$49,233
Interest Rate
5.08%
Mortgage Type
FHA
Create a Home Valuation Report for This Property
The Home Valuation Report is an in-depth analysis detailing your home's value as well as a comparison with similar homes in the area
Home Values in the Area
Average Home Value in this Area
Purchase History
| Date | Buyer | Sale Price | Title Company |
|---|---|---|---|
| Secretary Of Hud | -- | None Available | |
| Us Bank Na | $58,443 | None Available | |
| Mclellon Robert L | $49,000 | None Available |
Source: Public Records
Mortgage History
| Date | Status | Borrower | Loan Amount |
|---|---|---|---|
| Previous Owner | Mclellon Robert L | $49,233 |
Source: Public Records
Tax History Compared to Growth
Tax History
| Year | Tax Paid | Tax Assessment Tax Assessment Total Assessment is a certain percentage of the fair market value that is determined by local assessors to be the total taxable value of land and additions on the property. | Land | Improvement |
|---|---|---|---|---|
| 2025 | $1,040 | $61,400 | $6,300 | $55,100 |
| 2024 | $1,040 | $53,500 | $6,300 | $47,200 |
| 2023 | $770 | $53,500 | $6,300 | $47,200 |
| 2022 | $782 | $38,400 | $6,300 | $32,100 |
| 2021 | $782 | $38,400 | $6,300 | $32,100 |
| 2020 | $834 | $38,400 | $6,300 | $32,100 |
| 2019 | $1,242 | $38,400 | $6,300 | $32,100 |
| 2018 | $1,244 | $54,000 | $5,900 | $48,100 |
| 2017 | $1,244 | $51,600 | $0 | $0 |
| 2016 | $1,174 | $51,600 | $0 | $0 |
| 2015 | $1,174 | $51,600 | $0 | $0 |
| 2014 | $1,190 | $42,800 | $0 | $0 |
Source: Public Records
Map
Nearby Homes