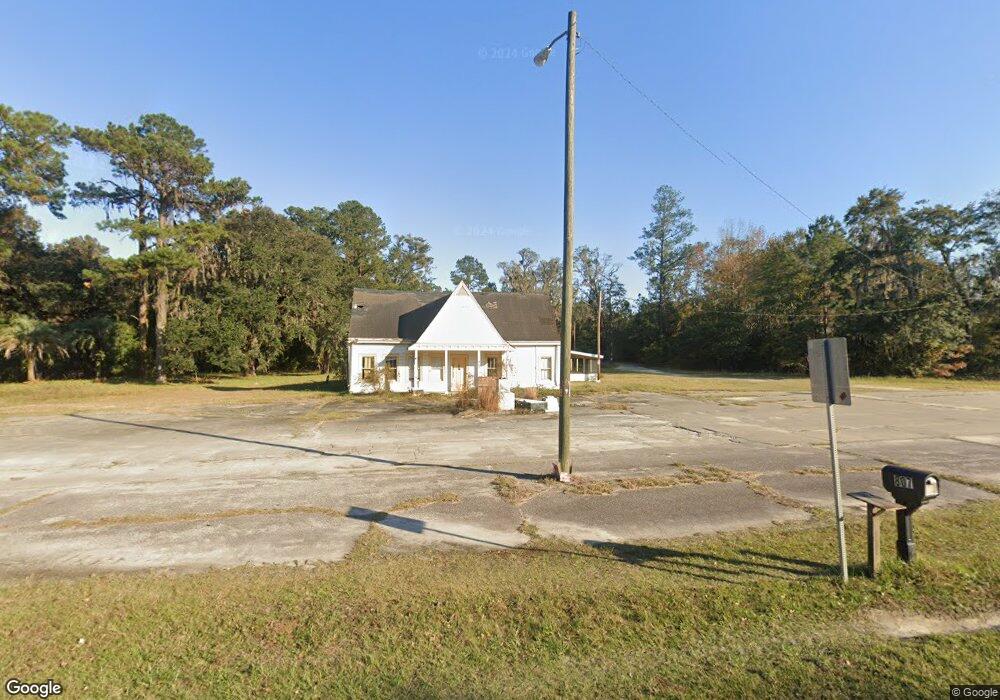
817 N Coastal Hwy Midway, GA 31320
Estimated Value: $321,000 - $550,876
4
Beds
3
Baths
240
Sq Ft
$1,816/Sq Ft
Est. Value
About This Home
This home is located at 817 N Coastal Hwy, Midway, GA 31320 and is currently estimated at $435,938, approximately $1,816 per square foot. 817 N Coastal Hwy is a home located in Liberty County with nearby schools including Liberty Elementary School, Midway Middle School, and Liberty County High School.
Ownership History
Date
Name
Owned For
Owner Type
Purchase Details
Closed on
May 20, 2025
Sold by
Smith Charles E
Bought by
Smith Family North Llc
Current Estimated Value
Purchase Details
Closed on
May 15, 2025
Sold by
Kennedy Donald F
Bought by
Kennedy Family South Llc
Purchase Details
Closed on
Jul 25, 2022
Sold by
Kennedy Betty Estate
Bought by
Kennedy Donald F and Kennedy Joey
Purchase Details
Closed on
Nov 19, 2009
Sold by
Smith Joe Est & Etal
Bought by
Kennedy Betty S and Smith Claudia B
Create a Home Valuation Report for This Property
The Home Valuation Report is an in-depth analysis detailing your home's value as well as a comparison with similar homes in the area
Home Values in the Area
Average Home Value in this Area
Purchase History
| Date | Buyer | Sale Price | Title Company |
|---|---|---|---|
| Smith Family North Llc | -- | -- | |
| Smith Family North Llc | -- | -- | |
| Smith Family North Llc | -- | -- | |
| Kennedy Family South Llc | -- | -- | |
| Kennedy Family South Llc | -- | -- | |
| Kennedy Family South Llc | -- | -- | |
| Kennedy Family South Llc | -- | -- | |
| Kennedy Family South Llc | -- | -- | |
| Kennedy Donald F | -- | -- | |
| Kennedy Betty S | -- | -- |
Source: Public Records
Tax History Compared to Growth
Tax History
| Year | Tax Paid | Tax Assessment Tax Assessment Total Assessment is a certain percentage of the fair market value that is determined by local assessors to be the total taxable value of land and additions on the property. | Land | Improvement |
|---|---|---|---|---|
| 2024 | $6,488 | $156,225 | $86,660 | $69,565 |
| 2023 | $6,488 | $147,919 | $86,660 | $61,259 |
| 2022 | $5,326 | $137,063 | $86,660 | $50,403 |
| 2021 | $5,104 | $131,779 | $86,660 | $45,119 |
| 2020 | $5,122 | $131,800 | $86,660 | $45,140 |
| 2019 | $5,012 | $132,373 | $86,660 | $45,713 |
| 2018 | $4,966 | $132,762 | $86,660 | $46,102 |
| 2017 | $5,657 | $133,324 | $86,660 | $46,664 |
| 2016 | $4,663 | $133,886 | $86,660 | $47,226 |
| 2015 | $6,088 | $131,806 | $84,581 | $47,226 |
| 2014 | $6,088 | $247,622 | $181,957 | $65,665 |
| 2013 | -- | $91,708 | $34,933 | $56,775 |
Source: Public Records
Map
Nearby Homes
- 92 Lachlan Ln
- 29 Sassafras Ln
- 35 Hollis Ln
- 152 Holland Dr
- 1019 Stone Ct
- 94 Buckingham Dr
- 1099 Stone Ct
- 1057 Stone Ct
- 54 Cottage Loop
- 92 Holland Dr NE
- 62 Carver Way
- 268 Alder Pass
- 931 Stone Ct
- 670 Stone Ct
- 124 Cooper St
- 443 Martin Rd
- 161 C Jones St
- 81 Button Gwinnett Ave
- 58 Saint Catherine St
- 49 Saint Catherine St