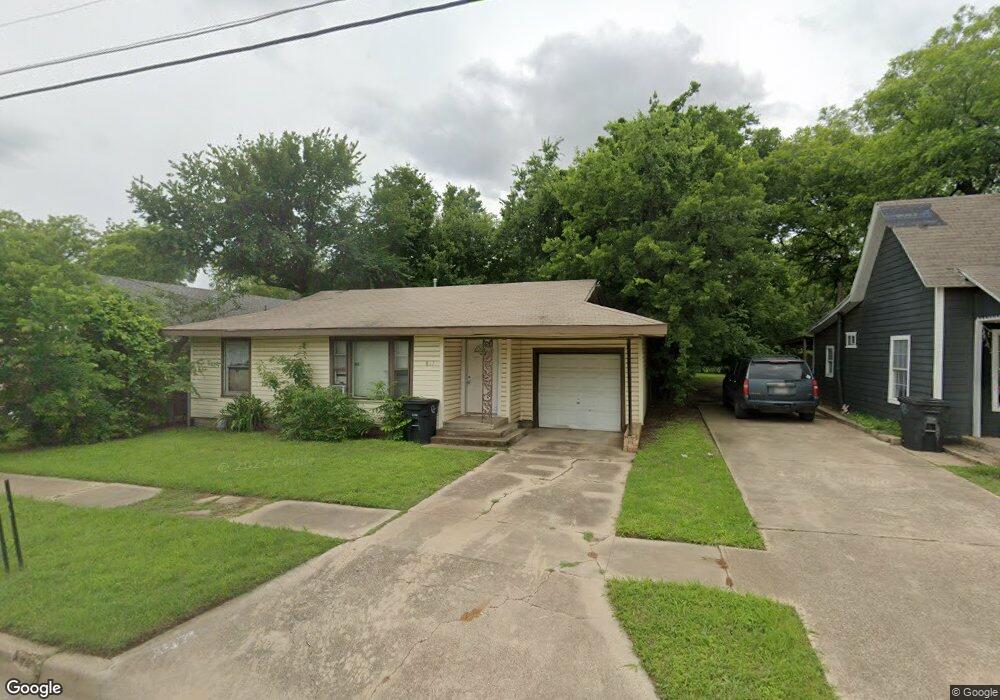
817 N Robinson St Cleburne, TX 76031
Estimated Value: $135,000 - $219,000
2
Beds
1
Bath
937
Sq Ft
$173/Sq Ft
Est. Value
About This Home
This home is located at 817 N Robinson St, Cleburne, TX 76031 and is currently estimated at $161,637, approximately $172 per square foot. 817 N Robinson St is a home located in Johnson County with nearby schools including Santa Fe Elementary School, Lowell Smith Jr. Middle School, and Cleburne High School.
Ownership History
Date
Name
Owned For
Owner Type
Purchase Details
Closed on
Feb 2, 2009
Sold by
Woodall Teddy J
Bought by
Woodall Jason A
Current Estimated Value
Create a Home Valuation Report for This Property
The Home Valuation Report is an in-depth analysis detailing your home's value as well as a comparison with similar homes in the area
Home Values in the Area
Average Home Value in this Area
Purchase History
| Date | Buyer | Sale Price | Title Company |
|---|---|---|---|
| Woodall Jason A | -- | None Available |
Source: Public Records
Tax History Compared to Growth
Tax History
| Year | Tax Paid | Tax Assessment Tax Assessment Total Assessment is a certain percentage of the fair market value that is determined by local assessors to be the total taxable value of land and additions on the property. | Land | Improvement |
|---|---|---|---|---|
| 2025 | $584 | $86,795 | $23,500 | $63,295 |
| 2024 | $1,411 | $63,293 | $0 | $0 |
| 2023 | $1,280 | $86,795 | $23,500 | $63,295 |
| 2022 | $1,309 | $86,795 | $23,500 | $63,295 |
| 2021 | $1,241 | $86,795 | $23,500 | $63,295 |
| 2020 | $1,198 | $58,290 | $20,000 | $38,290 |
| 2019 | $1,161 | $58,290 | $20,000 | $38,290 |
| 2018 | $1,056 | $35,727 | $8,500 | $27,227 |
| 2017 | $1,052 | $35,727 | $8,500 | $27,227 |
| 2016 | $1,052 | $35,727 | $8,500 | $27,227 |
| 2015 | $619 | $35,727 | $8,500 | $27,227 |
| 2014 | $619 | $33,394 | $8,500 | $24,894 |
Source: Public Records
Map
Nearby Homes
- 105 E Lone Star Ave
- 741 N Robinson St
- 109 Claude Ave
- 735 N Robinson St
- 107 Mcarthur Ln
- 709 N Wilhite St Unit 711
- 1609 N Brazos Ave
- 922 N Buffalo Ave
- 614 N Robinson St
- 1308 N Brazos Ave
- 612 N Robinson St
- 211 Huron St
- 1300 N Brazos Ave
- 603 N Anglin St
- 1014 Trinity St
- 1103 Chase Ave
- 308 Poindexter Ave
- 1204 N Wood St
- 1510 N Wilhite St
- 607 N Wood St
- 819 N Robinson St
- 815 N Robinson St
- 821 N Robinson St
- 109 Dallas Ave
- 208 E Lone Star Ave
- 823 N Robinson St
- 820 N Robinson St
- 818 N Robinson St
- 822 N Robinson St
- 107 Dallas Ave
- 824 N Robinson St
- 816 N Robinson St
- 813 N Robinson St
- 813 N Robinson St
- 826 N Robinson St
- 105 Dallas Ave
- 209 E Lone Star Ave
- 901 N Robinson St
- 814 N Robinson St
- 811 N Robinson St