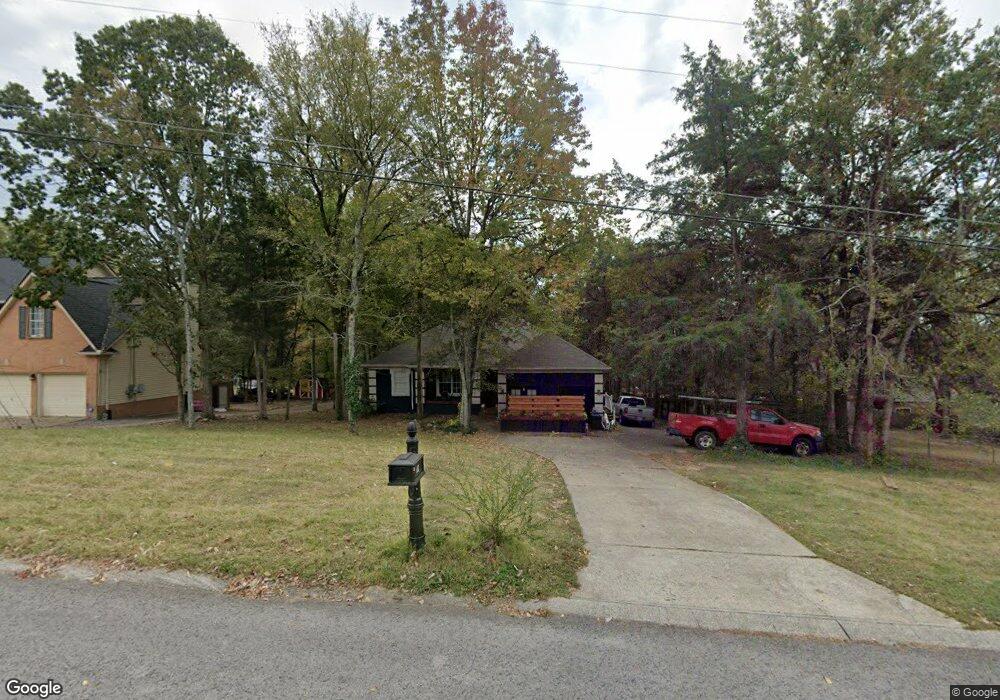
817 Rockwood Dr Nolensville, TN 37135
Estimated Value: $562,000 - $653,000
3
Beds
2
Baths
2,048
Sq Ft
$293/Sq Ft
Est. Value
About This Home
This home is located at 817 Rockwood Dr, Nolensville, TN 37135 and is currently estimated at $599,085, approximately $292 per square foot. 817 Rockwood Dr is a home located in Williamson County with nearby schools including Nolensville Elementary School, Mill Creek Middle School, and Nolensville High School.
Ownership History
Date
Name
Owned For
Owner Type
Purchase Details
Closed on
Jun 3, 2024
Sold by
Gray Jordan J
Bought by
Mckinney Elizabeth
Current Estimated Value
Purchase Details
Closed on
Nov 29, 2022
Sold by
Mckinney Elizabeth
Bought by
Mckinney Elizabeth and Gray Jordan J
Purchase Details
Closed on
Aug 25, 2022
Sold by
Mckinney James M
Bought by
Maxey Elizabeth
Purchase Details
Closed on
Nov 4, 2010
Sold by
Mcdermott Brenda J and Mcdermott William J
Bought by
Secretary Of Housing & Urban Development
Purchase Details
Closed on
Jul 26, 2005
Sold by
Pease Robert J and Pease Rebecca N
Bought by
Mcdermott William J and Mcdermott Brenda J
Home Financials for this Owner
Home Financials are based on the most recent Mortgage that was taken out on this home.
Original Mortgage
$172,800
Interest Rate
5.75%
Mortgage Type
Purchase Money Mortgage
Purchase Details
Closed on
Feb 22, 1994
Sold by
Davis Jimmy W
Bought by
Pease Robert J
Create a Home Valuation Report for This Property
The Home Valuation Report is an in-depth analysis detailing your home's value as well as a comparison with similar homes in the area
Home Values in the Area
Average Home Value in this Area
Purchase History
| Date | Buyer | Sale Price | Title Company |
|---|---|---|---|
| Mckinney Elizabeth | -- | Stewart Title | |
| Mckinney Elizabeth | -- | -- | |
| Maxey Elizabeth | -- | None Listed On Document | |
| Secretary Of Housing & Urban Development | $250,603 | None Available | |
| Mcdermott William J | $216,000 | Mooreland Title | |
| Pease Robert J | $121,000 | -- |
Source: Public Records
Mortgage History
| Date | Status | Borrower | Loan Amount |
|---|---|---|---|
| Previous Owner | Mcdermott William J | $172,800 |
Source: Public Records
Tax History Compared to Growth
Tax History
| Year | Tax Paid | Tax Assessment Tax Assessment Total Assessment is a certain percentage of the fair market value that is determined by local assessors to be the total taxable value of land and additions on the property. | Land | Improvement |
|---|---|---|---|---|
| 2025 | $1,753 | $129,225 | $47,500 | $81,725 |
| 2024 | $1,753 | $80,800 | $21,250 | $59,550 |
| 2023 | $1,753 | $80,800 | $21,250 | $59,550 |
| 2022 | $1,753 | $80,800 | $21,250 | $59,550 |
| 2021 | $1,753 | $80,800 | $21,250 | $59,550 |
| 2020 | $1,527 | $60,850 | $15,000 | $45,850 |
| 2019 | $1,442 | $60,850 | $15,000 | $45,850 |
| 2018 | $1,399 | $60,850 | $15,000 | $45,850 |
| 2017 | $1,387 | $60,850 | $15,000 | $45,850 |
| 2016 | $0 | $60,850 | $15,000 | $45,850 |
| 2015 | -- | $50,550 | $12,500 | $38,050 |
| 2014 | -- | $50,550 | $12,500 | $38,050 |
Source: Public Records
Map
Nearby Homes
- 0 Nolensville Rd Unit RTC2807764
- 0 Nolensville Rd Unit RTC2818506
- 0 Bostic Unit RTC2516475
- 0 Nolensville Rd Unit RTC3017763
- 829 Stonebrook Blvd
- 1115 Oak Creek Dr
- 720 Stonecastle Place
- 1016 Dortch Ln
- 813 Stonebrook Blvd
- 607 Quarter Horse Ln
- 2248 Rolling Hills Dr
- 2276 Rolling Hills Dr
- 1228 Countryside Rd
- 3025 Ash Dale Ln
- 3051 Ash Dale Ln
- 3019 Ash Dale Ln
- 3027 Ash Dale Ln
- 4028 Rosa Dr
- 625 Mer Rouge Dr
- 825 Piccadilly Dr
- 815 Rockwood Dr
- 800 Brownstone Ct
- 813 Rockwood Dr
- 808 Brownstone Ct
- 913 Timberside Dr
- 1101 Michelle Ct
- 811 Rockwood Dr
- 911 Timberside Dr
- 915 Timberside Dr
- 1894 Abbywood Drive-Lot 28
- 1100 Michelle Ct
- 909 Timberside Dr
- 801 Brownstone Ct
- 809 Rockwood Dr
- 907 Timberside Dr
- 809 Brownstone Ct
- 1103 Michelle Ct
- 805 Brownstone Ct
- 1102 Michelle Ct
- 919 Timberside Dr