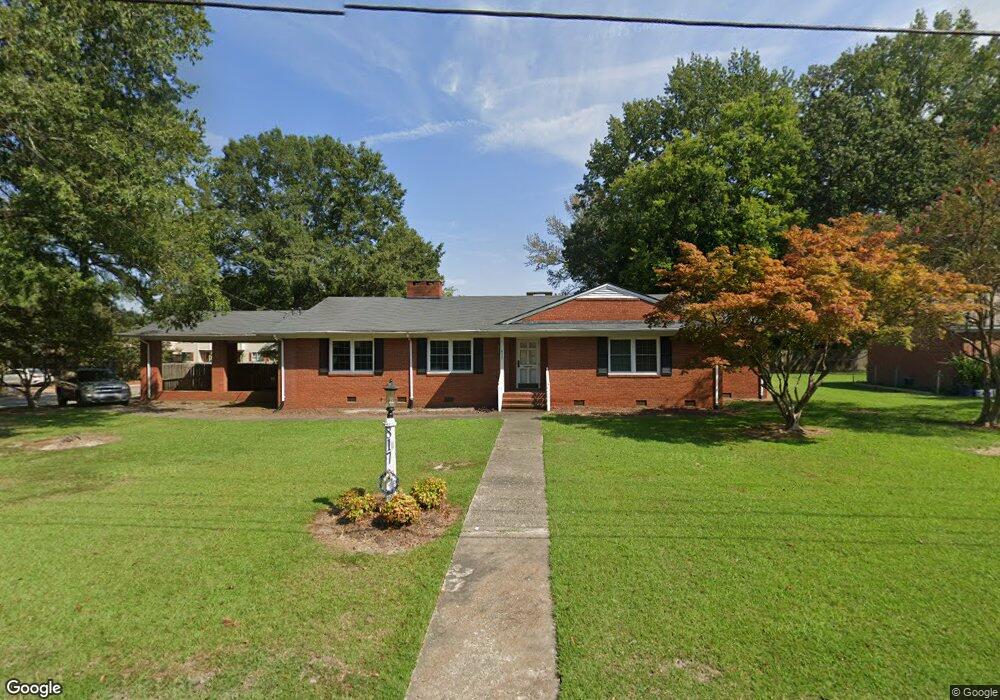
817 S 2nd St Smithfield, NC 27577
Estimated Value: $309,166 - $380,000
3
Beds
2
Baths
2,506
Sq Ft
$133/Sq Ft
Est. Value
About This Home
This home is located at 817 S 2nd St, Smithfield, NC 27577 and is currently estimated at $332,292, approximately $132 per square foot. 817 S 2nd St is a home located in Johnston County with nearby schools including South Smithfield Elementary School, Smithfield Middle School, and Smithfield-Selma High School.
Ownership History
Date
Name
Owned For
Owner Type
Purchase Details
Closed on
Jan 24, 2019
Sold by
Ezuma Obiezirike Innocent and Ezuma Obiageli Lillian
Bought by
Ultimate I Properties Llc
Current Estimated Value
Purchase Details
Closed on
Jun 19, 2008
Sold by
Glover B Chester and Glover Sarah C
Bought by
Okoro Lillian and Ezuma Innocent
Home Financials for this Owner
Home Financials are based on the most recent Mortgage that was taken out on this home.
Original Mortgage
$186,148
Interest Rate
6.08%
Mortgage Type
FHA
Create a Home Valuation Report for This Property
The Home Valuation Report is an in-depth analysis detailing your home's value as well as a comparison with similar homes in the area
Home Values in the Area
Average Home Value in this Area
Purchase History
| Date | Buyer | Sale Price | Title Company |
|---|---|---|---|
| Ultimate I Properties Llc | -- | None Available | |
| Okoro Lillian | $188,000 | None Available |
Source: Public Records
Mortgage History
| Date | Status | Borrower | Loan Amount |
|---|---|---|---|
| Previous Owner | Okoro Lillian | $186,148 |
Source: Public Records
Tax History
| Year | Tax Paid | Tax Assessment Tax Assessment Total Assessment is a certain percentage of the fair market value that is determined by local assessors to be the total taxable value of land and additions on the property. | Land | Improvement |
|---|---|---|---|---|
| 2025 | $2,305 | $237,630 | $80,000 | $157,630 |
| 2024 | $2,291 | $184,770 | $60,000 | $124,770 |
| 2023 | $2,328 | $184,770 | $60,000 | $124,770 |
| 2022 | $2,402 | $184,770 | $60,000 | $124,770 |
| 2021 | $2,402 | $184,770 | $60,000 | $124,770 |
| 2020 | $2,457 | $184,770 | $60,000 | $124,770 |
| 2019 | $2,457 | $184,770 | $60,000 | $124,770 |
| 2018 | $2,531 | $187,480 | $54,000 | $133,480 |
| 2017 | $2,531 | $187,480 | $54,000 | $133,480 |
| 2016 | $2,531 | $187,480 | $54,000 | $133,480 |
| 2015 | $2,531 | $187,480 | $54,000 | $133,480 |
| 2014 | $2,531 | $187,480 | $54,000 | $133,480 |
Source: Public Records
Map
Nearby Homes
Your Personal Tour Guide
Ask me questions while you tour the home.