Estimated Value: $175,619 - $195,000
4
Beds
1
Bath
1,195
Sq Ft
$154/Sq Ft
Est. Value
About This Home
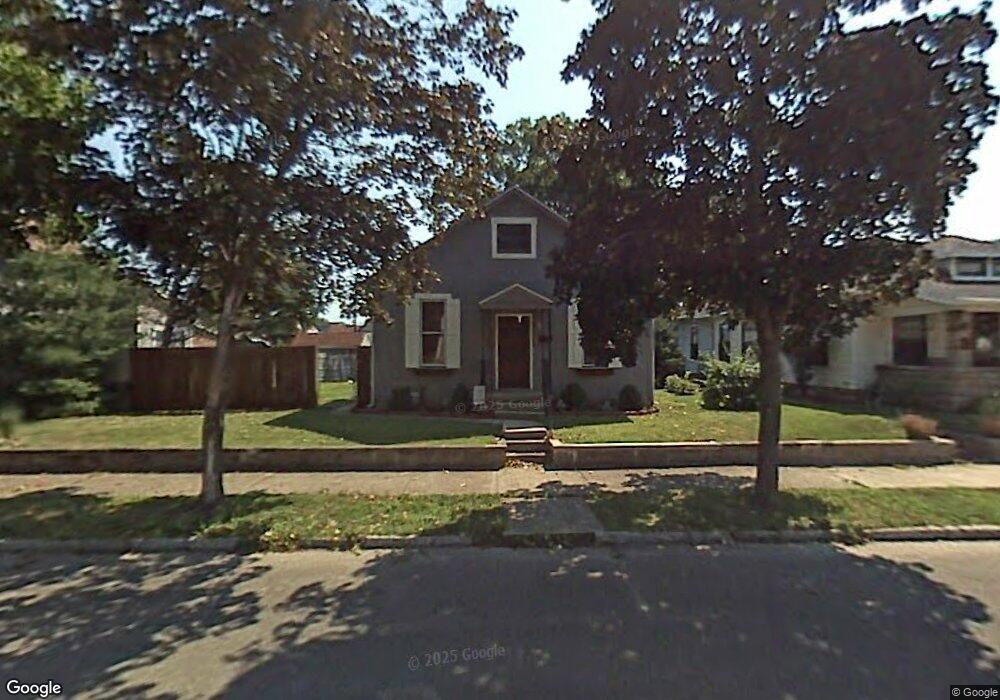
This home is located at 817 S Clay St, Troy, OH 45373 and is currently estimated at $183,655, approximately $153 per square foot. 817 S Clay St is a home located in Miami County with nearby schools including Kyle Elementary School, Van Cleve Elementary School, and Troy Junior High School.
Ownership History
Date
Name
Owned For
Owner Type
Purchase Details
Closed on
Apr 12, 2018
Sold by
Royse Thomas W and Royse Janice C
Bought by
Wolfe Cathy and Bigos Anthony
Current Estimated Value
Purchase Details
Closed on
Jun 13, 2012
Sold by
Gray Steven and Gray Heather
Bought by
Royse Thomas W and Royse Janice C
Purchase Details
Closed on
Oct 19, 2005
Sold by
Jackson Douglas R and Jackson Shauna J
Bought by
Gray Steven and Gray Heather
Home Financials for this Owner
Home Financials are based on the most recent Mortgage that was taken out on this home.
Original Mortgage
$87,500
Interest Rate
5.82%
Mortgage Type
New Conventional
Purchase Details
Closed on
May 4, 1999
Sold by
Darnell Michael E and Darnell Paula J
Bought by
Jackson Douglas R and Kinnison Shauna J
Home Financials for this Owner
Home Financials are based on the most recent Mortgage that was taken out on this home.
Original Mortgage
$83,282
Interest Rate
7.05%
Purchase Details
Closed on
Apr 13, 1994
Bought by
Wiford Jeffrey S
Create a Home Valuation Report for This Property
The Home Valuation Report is an in-depth analysis detailing your home's value as well as a comparison with similar homes in the area
Home Values in the Area
Average Home Value in this Area
Purchase History
| Date | Buyer | Sale Price | Title Company |
|---|---|---|---|
| Wolfe Cathy | -- | None Available | |
| Royse Thomas W | $23,600 | First Title | |
| Gray Steven | $87,500 | -- | |
| Jackson Douglas R | $83,500 | -- | |
| Wiford Jeffrey S | $59,000 | -- |
Source: Public Records
Mortgage History
| Date | Status | Borrower | Loan Amount |
|---|---|---|---|
| Previous Owner | Jackson Douglas R | $87,500 | |
| Previous Owner | Jackson Douglas R | $83,282 |
Source: Public Records
Tax History
| Year | Tax Paid | Tax Assessment Tax Assessment Total Assessment is a certain percentage of the fair market value that is determined by local assessors to be the total taxable value of land and additions on the property. | Land | Improvement |
|---|---|---|---|---|
| 2025 | $1,897 | $53,910 | $8,020 | $45,890 |
| 2024 | $1,897 | $37,380 | $8,330 | $29,050 |
| 2023 | $1,669 | $37,380 | $8,330 | $29,050 |
| 2022 | $1,434 | $37,380 | $8,330 | $29,050 |
| 2021 | $1,243 | $29,890 | $6,650 | $23,240 |
| 2020 | $1,244 | $29,890 | $6,650 | $23,240 |
| 2019 | $1,026 | $29,890 | $6,650 | $23,240 |
| 2018 | $918 | $25,700 | $7,180 | $18,520 |
| 2017 | $927 | $25,700 | $7,180 | $18,520 |
| 2016 | $915 | $25,700 | $7,180 | $18,520 |
| 2015 | $884 | $23,800 | $6,650 | $17,150 |
| 2014 | $884 | $23,800 | $6,650 | $17,150 |
| 2013 | $890 | $23,800 | $6,650 | $17,150 |
Source: Public Records
Map
Nearby Homes
- 712 S Clay St
- 436 S Clay St
- 67 W Dakota St
- 424 S Counts St
- 504 S Market St
- 517 S Cherry St
- 996 Stony Brook Ln
- 408 S Market St
- 619 E Canal St
- 118 S Walnut St
- 119 Morehead St
- 920 Old Nursery Trail
- 385 W Ross St
- 216 S Short St
- 19 S Cherry St
- 510 Drury Ln
- 339 Lincoln Ave
- 0 Ohio 55
- 509 Mckaig Ave
- 425 W Franklin St
- 807 S Clay St
- 821 S Clay St
- 801 S Clay St
- 825 S Clay St
- 814 S Crawford St
- 818 S Crawford St
- 831 S Clay St
- 802 S Crawford St
- 824 S Crawford St
- 820 S Clay St
- 808 S Clay St
- 723 S Clay St
- 315 Young St
- 828 S Crawford St
- 824 S Clay St
- 802 S Clay St
- 830 S Clay St
- 724 S Crawford St
- 717 S Clay St
- 901 S Clay St
Your Personal Tour Guide
Ask me questions while you tour the home.