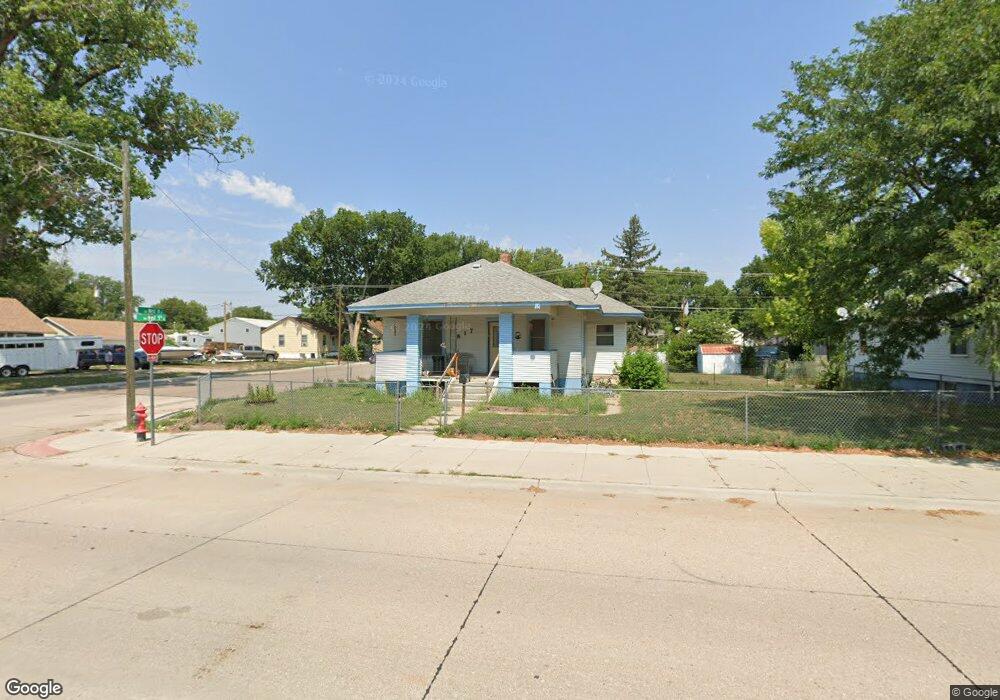
817 W 5th St Ogallala, NE 69153
Estimated Value: $125,606 - $165,000
2
Beds
1
Bath
912
Sq Ft
$161/Sq Ft
Est. Value
About This Home
This home is located at 817 W 5th St, Ogallala, NE 69153 and is currently estimated at $147,152, approximately $161 per square foot. 817 W 5th St is a home with nearby schools including Ogallala High School, St. Paul's Lutheran School, and St. Luke's Elementary School.
Ownership History
Date
Name
Owned For
Owner Type
Purchase Details
Closed on
Jan 16, 2024
Sold by
Byers Andrew C and Byers Lisa
Bought by
Wright Marvin L and Wright Sarah J
Current Estimated Value
Purchase Details
Closed on
Jan 22, 2009
Sold by
Deutsche Bank National Trust Co
Bought by
Byers Andrew C and Byers Lisa
Home Financials for this Owner
Home Financials are based on the most recent Mortgage that was taken out on this home.
Original Mortgage
$25,000
Interest Rate
5.17%
Mortgage Type
Future Advance Clause Open End Mortgage
Purchase Details
Closed on
Mar 11, 2006
Sold by
Walters Robert J
Bought by
Smith Jeremy J and Smith Kellie J
Home Financials for this Owner
Home Financials are based on the most recent Mortgage that was taken out on this home.
Original Mortgage
$56,700
Interest Rate
9.15%
Mortgage Type
Adjustable Rate Mortgage/ARM
Create a Home Valuation Report for This Property
The Home Valuation Report is an in-depth analysis detailing your home's value as well as a comparison with similar homes in the area
Home Values in the Area
Average Home Value in this Area
Purchase History
| Date | Buyer | Sale Price | Title Company |
|---|---|---|---|
| Wright Marvin L | $64,000 | None Listed On Document | |
| Byers Andrew C | $20,000 | None Available | |
| Smith Jeremy J | $63,000 | None Available |
Source: Public Records
Mortgage History
| Date | Status | Borrower | Loan Amount |
|---|---|---|---|
| Previous Owner | Byers Andrew C | $25,000 | |
| Previous Owner | Smith Jeremy J | $56,700 |
Source: Public Records
Tax History Compared to Growth
Tax History
| Year | Tax Paid | Tax Assessment Tax Assessment Total Assessment is a certain percentage of the fair market value that is determined by local assessors to be the total taxable value of land and additions on the property. | Land | Improvement |
|---|---|---|---|---|
| 2024 | $746 | $70,015 | $18,225 | $51,790 |
| 2023 | $887 | $63,560 | $15,190 | $48,370 |
| 2022 | $797 | $50,300 | $12,375 | $37,925 |
| 2021 | $789 | $48,225 | $12,375 | $35,850 |
| 2020 | $1,267 | $76,725 | $12,375 | $64,350 |
| 2019 | $1,222 | $70,825 | $11,250 | $59,575 |
| 2018 | $1,154 | $65,570 | $11,250 | $54,320 |
| 2017 | $1,136 | $64,150 | $11,250 | $52,900 |
| 2016 | $1,167 | $64,150 | $11,250 | $52,900 |
| 2015 | $1,030 | $52,435 | $9,375 | $43,060 |
| 2010 | -- | $48,480 | $9,375 | $39,105 |
Source: Public Records
Map
Nearby Homes