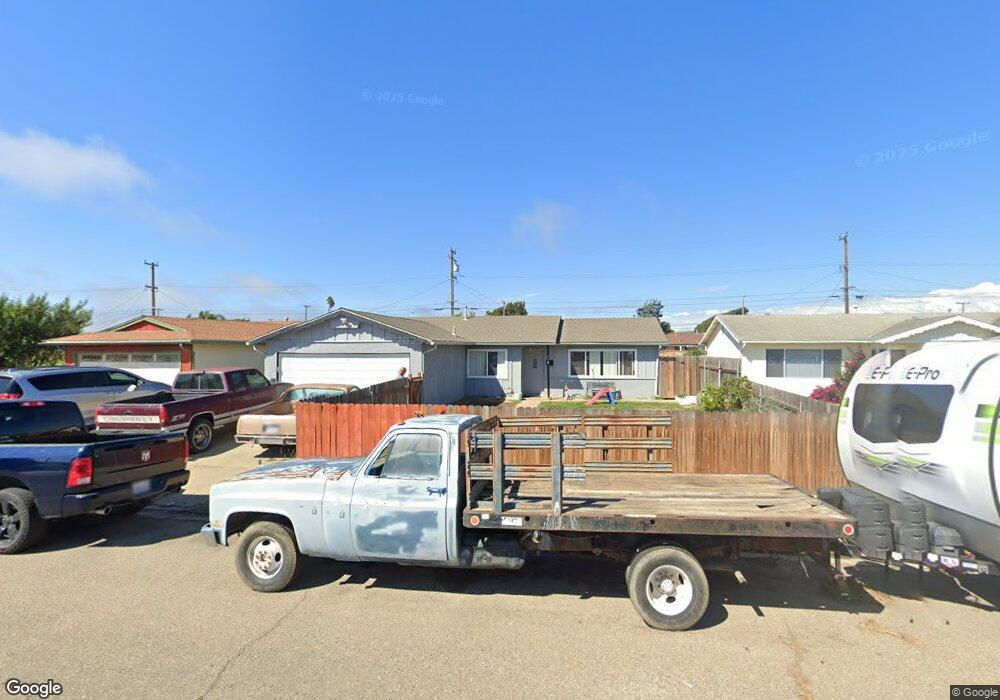
817 W Nectarine Ave Lompoc, CA 93436
Estimated Value: $494,000 - $510,712
3
Beds
2
Baths
1,090
Sq Ft
$459/Sq Ft
Est. Value
About This Home
This home is located at 817 W Nectarine Ave, Lompoc, CA 93436 and is currently estimated at $500,178, approximately $458 per square foot. 817 W Nectarine Ave is a home located in Santa Barbara County with nearby schools including La Canada Elementary School, Lompoc Valley Middle School, and Lompoc High School.
Ownership History
Date
Name
Owned For
Owner Type
Purchase Details
Closed on
Jul 13, 2021
Sold by
Klawiter Gloria Ann and The Gloria Ann Klawiter Living
Bought by
Fonseca Edwin and Magana Yuliana
Current Estimated Value
Home Financials for this Owner
Home Financials are based on the most recent Mortgage that was taken out on this home.
Original Mortgage
$392,755
Outstanding Balance
$356,364
Interest Rate
2.9%
Mortgage Type
FHA
Estimated Equity
$143,814
Purchase Details
Closed on
May 13, 2016
Sold by
Klawiter Gloria Ann
Bought by
Klawiter Gloria Ann
Purchase Details
Closed on
Aug 27, 2015
Sold by
Klawiter Gloria A
Bought by
Klawiter Gloria A
Home Financials for this Owner
Home Financials are based on the most recent Mortgage that was taken out on this home.
Original Mortgage
$163,500
Interest Rate
3.97%
Mortgage Type
New Conventional
Purchase Details
Closed on
Apr 14, 2011
Sold by
Klawiter Betty Ann
Bought by
Klawiter Betty Ann
Create a Home Valuation Report for This Property
The Home Valuation Report is an in-depth analysis detailing your home's value as well as a comparison with similar homes in the area
Home Values in the Area
Average Home Value in this Area
Purchase History
| Date | Buyer | Sale Price | Title Company |
|---|---|---|---|
| Fonseca Edwin | $400,000 | Fidelity National Title Co | |
| Klawiter Gloria Ann | -- | None Available | |
| Klawiter Gloria A | -- | First American Title Company | |
| Klawiter Betty Ann | -- | None Available |
Source: Public Records
Mortgage History
| Date | Status | Borrower | Loan Amount |
|---|---|---|---|
| Open | Fonseca Edwin | $392,755 | |
| Previous Owner | Klawiter Gloria A | $163,500 |
Source: Public Records
Tax History
| Year | Tax Paid | Tax Assessment Tax Assessment Total Assessment is a certain percentage of the fair market value that is determined by local assessors to be the total taxable value of land and additions on the property. | Land | Improvement |
|---|---|---|---|---|
| 2025 | $4,627 | $424,482 | $127,344 | $297,138 |
| 2023 | $4,627 | $408,000 | $122,400 | $285,600 |
| 2022 | $4,547 | $400,000 | $120,000 | $280,000 |
| 2021 | $1,739 | $152,822 | $50,954 | $101,868 |
| 2020 | $1,720 | $151,256 | $50,432 | $100,824 |
| 2019 | $1,690 | $148,292 | $49,444 | $98,848 |
| 2018 | $1,662 | $145,385 | $48,475 | $96,910 |
| 2017 | $1,630 | $142,535 | $47,525 | $95,010 |
| 2016 | $1,599 | $139,742 | $46,594 | $93,148 |
| 2015 | $534 | $48,748 | $12,990 | $35,758 |
| 2014 | $525 | $47,794 | $12,736 | $35,058 |
Source: Public Records
Map
Nearby Homes
- 531 N O St
- 901 Alden Ave
- 526 N L St
- 1012 W Anthony Way
- 516 N U St
- 1355 Crown Cir
- 321 W North Ave Unit 133
- 1445 Crown Cir
- 510 N I St
- 1011 W Walnut Ave
- 217 N M St
- 267 Village Circle Dr
- 533 N G St
- 23 Village Circle Dr
- 60 Village Circle Dr
- 1408 W Walnut Ave
- 1410 W Apricot Ave
- 1103 Point Sal Loop
- 112 N X St
- 117 S I St
- 821 W Nectarine Ave
- 813 W Nectarine Ave
- 901 W Nectarine Ave
- 809 W Nectarine Ave
- 816 W Pine Ave
- 820 W Pine Ave
- 812 W Pine Ave
- 101 W Nectarine Ave
- 816 W Nectarine Ave
- 900 W Pine Ave
- 808 W Pine Ave
- 905 W Nectarine Ave
- 805 W Nectarine Ave
- 820 W Nectarine Ave
- 900 W Nectarine Ave
- 808 W Nectarine Ave
- 904 W Pine Ave
- 804 W Pine Ave
- 909 W Nectarine Ave
- 904 W Nectarine Ave
Your Personal Tour Guide
Ask me questions while you tour the home.