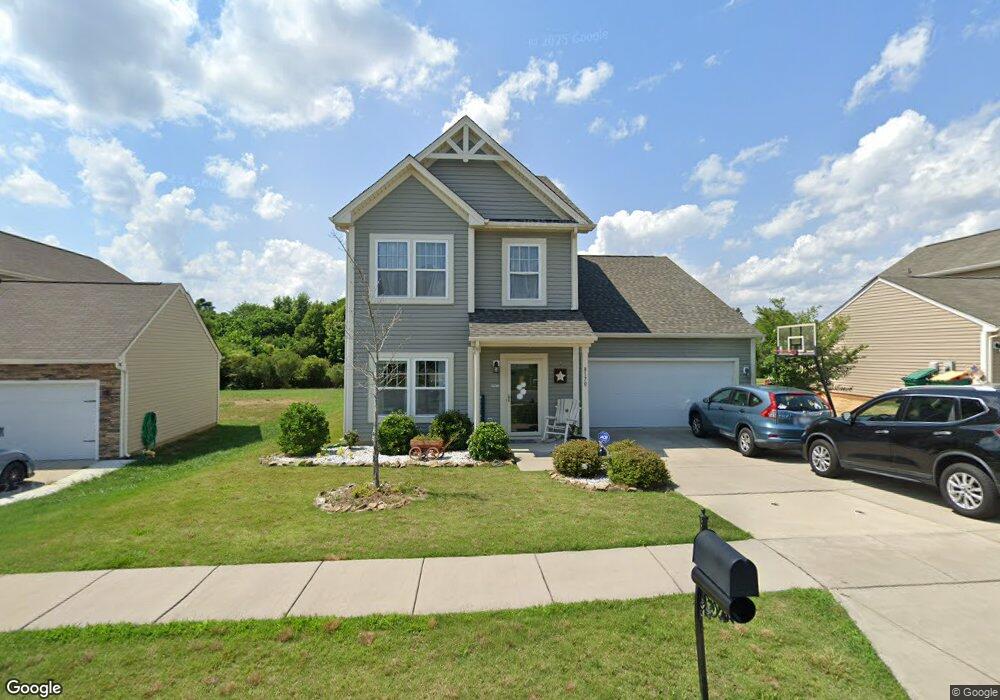
8170 Chilkoot Ln Locust, NC 28097
Estimated Value: $387,000 - $487,000
5
Beds
4
Baths
3,182
Sq Ft
$133/Sq Ft
Est. Value
About This Home
This home is located at 8170 Chilkoot Ln, Locust, NC 28097 and is currently estimated at $423,100, approximately $132 per square foot. 8170 Chilkoot Ln is a home located in Cabarrus County with nearby schools including A.T. Allen Elementary School, Mount Pleasant Middle School, and Mount Pleasant High School.
Ownership History
Date
Name
Owned For
Owner Type
Purchase Details
Closed on
Aug 22, 2014
Sold by
True Homes Llc
Bought by
Lundberg Lindsay A and Lundberg Daniel J
Current Estimated Value
Home Financials for this Owner
Home Financials are based on the most recent Mortgage that was taken out on this home.
Original Mortgage
$188,775
Outstanding Balance
$144,370
Interest Rate
4.19%
Mortgage Type
New Conventional
Estimated Equity
$278,730
Purchase Details
Closed on
Oct 11, 2013
Sold by
Boex Llc
Bought by
True Homes Llc
Purchase Details
Closed on
Sep 1, 2013
Sold by
Rl Regi North Carolina Llc
Bought by
Boex Llv
Purchase Details
Closed on
Mar 30, 2010
Sold by
Regions Bank
Bought by
Rl Regi North Carolina Llc
Create a Home Valuation Report for This Property
The Home Valuation Report is an in-depth analysis detailing your home's value as well as a comparison with similar homes in the area
Home Values in the Area
Average Home Value in this Area
Purchase History
| Date | Buyer | Sale Price | Title Company |
|---|---|---|---|
| Lundberg Lindsay A | $188,000 | None Available | |
| True Homes Llc | $128,000 | None Available | |
| Boex Llv | $5,500,000 | -- | |
| Rl Regi North Carolina Llc | $310,000 | None Available |
Source: Public Records
Mortgage History
| Date | Status | Borrower | Loan Amount |
|---|---|---|---|
| Open | Lundberg Lindsay A | $188,775 |
Source: Public Records
Tax History
| Year | Tax Paid | Tax Assessment Tax Assessment Total Assessment is a certain percentage of the fair market value that is determined by local assessors to be the total taxable value of land and additions on the property. | Land | Improvement |
|---|---|---|---|---|
| 2025 | $4,334 | $440,810 | $66,000 | $374,810 |
| 2024 | $4,643 | $440,810 | $66,000 | $374,810 |
| 2023 | $3,177 | $256,450 | $40,500 | $215,950 |
| 2022 | $3,177 | $256,450 | $40,500 | $215,950 |
| 2021 | $3,177 | $256,450 | $40,500 | $215,950 |
| 2020 | $3,177 | $256,450 | $40,500 | $215,950 |
| 2019 | $2,507 | $200,210 | $16,000 | $184,210 |
| 2018 | $2,466 | $200,210 | $16,000 | $184,210 |
| 2017 | $2,426 | $200,210 | $16,000 | $184,210 |
| 2016 | $2,426 | $210,920 | $15,000 | $195,920 |
| 2015 | $138 | $12,000 | $12,000 | $0 |
| 2014 | $138 | $12,000 | $12,000 | $0 |
Source: Public Records
Map
Nearby Homes
- 8168 Thorton St
- 8168 Thornton St
- 8164 Thorton St
- 8164 Thornton St
- 8160 Thornton St
- 8160 Thorton St
- 8062 Midas Ln
- 8167 Thorton St
- 8167 Thornton St
- 8163 Thornton St
- 8163 Thorton St
- 8159 Thornton St
- 8159 Thorton St
- 8836 Cornwall St
- 435 Whispering Hills Dr Unit 153bp
- 431 Whispering Hills Dr Unit 154bp
- 415 Whispering Hills Dr Unit 158bp
- 423 Whispering Hills Dr Unit 156bp
- 419 Whispering Hills Dr Unit 157bp
- 427 Whispering Hills Dr Unit 155bp
- 8170 Chilkoot Ln Unit 106
- 8164 Chilkoot Ln Unit 107
- 8164 Chilkoot Ln
- 8164 Chilkoot Ln
- 8176 Chilkoot Ln Unit Lot 105
- 8176 Chilkoot Ln
- 8158 Chilkoot Ln
- 8158 Chilkoot Ln Unit 108
- 8182 Chilkoot Ln
- 8187 Chilkoot Ln
- 8167 Chilkoot Ln
- 8173 Chilkoot Ln Unit Lot 184
- 8152 Chilkoot Ln Unit Lot 109
- 8161 Chilkoot Ln
- 8188 Chilkoot Ln
- 8188 Chilkoot Ln Unit 103
- 8155 Chilkoot Ln
- 8155 Chilkoot Ln Unit 187
- 8149 Chilkoot Ln
- 8146 Chilkoot Ln
Your Personal Tour Guide
Ask me questions while you tour the home.