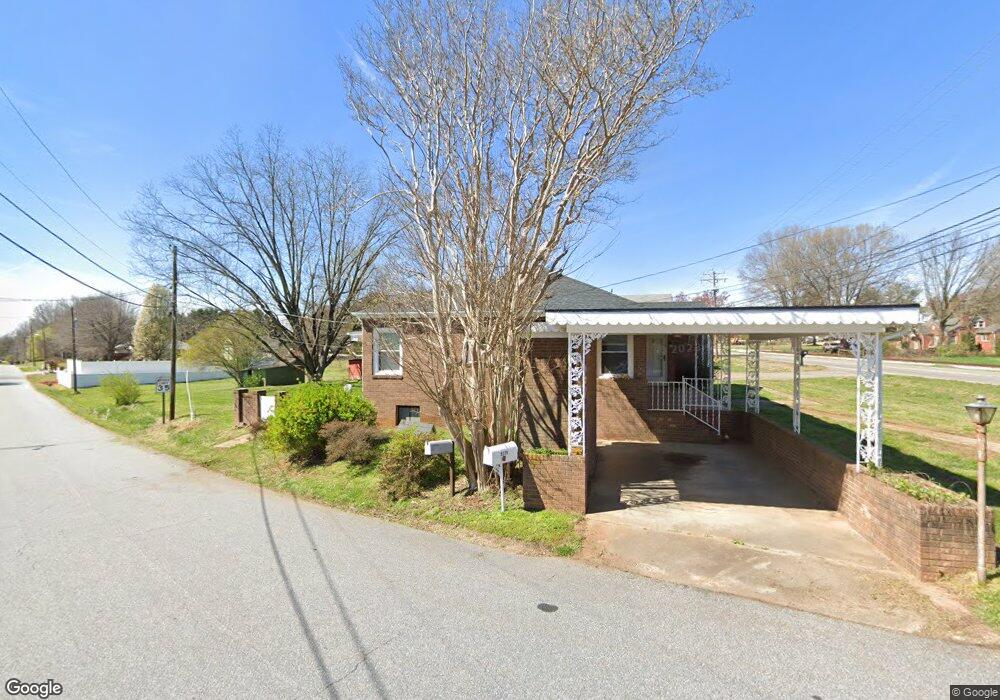
8170 State Highway 90 Stony Point, NC 28678
Stony Point NeighborhoodEstimated Value: $174,457 - $364,000
3
Beds
1
Bath
1,286
Sq Ft
$183/Sq Ft
Est. Value
About This Home
This home is located at 8170 State Highway 90, Stony Point, NC 28678 and is currently estimated at $235,614, approximately $183 per square foot. 8170 State Highway 90 is a home located in Alexander County with nearby schools including Stony Point Elementary School, East Alexander Middle School, and Alexander Central High School.
Ownership History
Date
Name
Owned For
Owner Type
Purchase Details
Closed on
Apr 21, 2021
Sold by
Stearns Lending Llc
Bought by
Justen Erik and Morrison Michael
Current Estimated Value
Purchase Details
Closed on
Jan 27, 2021
Sold by
Cape Fear Trustee Services Llc
Bought by
Movement Mortgage Llc and Grubb
Purchase Details
Closed on
Jan 26, 2021
Sold by
Grubb Thomas Wayne and Grubb Angela Dawn
Bought by
Stearns Lending Llc
Purchase Details
Closed on
May 30, 2013
Sold by
Hamby William Todd and Hamby Kylie Cockrell
Bought by
Grabb Thomas Wayne and Grabb Angela Dawn
Home Financials for this Owner
Home Financials are based on the most recent Mortgage that was taken out on this home.
Original Mortgage
$84,591
Interest Rate
3.91%
Mortgage Type
New Conventional
Create a Home Valuation Report for This Property
The Home Valuation Report is an in-depth analysis detailing your home's value as well as a comparison with similar homes in the area
Home Values in the Area
Average Home Value in this Area
Purchase History
| Date | Buyer | Sale Price | Title Company |
|---|---|---|---|
| Justen Erik | $49,000 | None Available | |
| Movement Mortgage Llc | -- | None Listed On Document | |
| Stearns Lending Llc | $79,920 | None Available | |
| Grabb Thomas Wayne | $83,000 | None Available |
Source: Public Records
Mortgage History
| Date | Status | Borrower | Loan Amount |
|---|---|---|---|
| Previous Owner | Grabb Thomas Wayne | $84,591 |
Source: Public Records
Tax History Compared to Growth
Tax History
| Year | Tax Paid | Tax Assessment Tax Assessment Total Assessment is a certain percentage of the fair market value that is determined by local assessors to be the total taxable value of land and additions on the property. | Land | Improvement |
|---|---|---|---|---|
| 2025 | $923 | $126,369 | $10,243 | $116,126 |
| 2024 | $935 | $126,369 | $10,243 | $116,126 |
| 2023 | $935 | $126,369 | $10,243 | $116,126 |
| 2022 | $663 | $77,133 | $9,312 | $67,821 |
| 2021 | $663 | $77,133 | $9,312 | $67,821 |
| 2020 | $663 | $77,133 | $9,312 | $67,821 |
| 2019 | $663 | $77,133 | $9,312 | $67,821 |
| 2018 | $656 | $77,133 | $9,312 | $67,821 |
| 2017 | $656 | $77,133 | $9,312 | $67,821 |
| 2016 | $656 | $77,133 | $9,312 | $67,821 |
| 2015 | $656 | $77,133 | $9,312 | $67,821 |
| 2014 | $656 | $84,664 | $9,312 | $75,352 |
| 2012 | -- | $84,664 | $9,312 | $75,352 |
Source: Public Records
Map
Nearby Homes
- 8170 Nc Hwy 90 E
- 116 Barnes Ln
- 61 Stony Point School Rd
- 201 Barnes Ln
- 290 Mill Hill Ct
- 100 Springs Ct
- 0 Old Mountain Rd Unit CAR4304814
- 1457 Smith Farm Rd
- 4723 Old Mountain Rd
- 35 Little Round Top Dr
- 163 Primrose Dr
- 65 Shotwell Patterson Ln
- 1595 Cheatham Ford Rd
- 48 Jeannes Ct
- 51 Rosemont Dr
- 568 Drumstand Rd
- 2170 Mount Wesley Church Rd
- 5665 N Carolina 90
- 115 Cherry Blossom Ln Unit 3
- 186 Blanche Ln
- 8170 N Carolina 90
- 8154 Us Highway 64 90 W
- 8212 N Carolina 90
- 8138 Nc Hwy 90 E
- 8191 Nc 90 Hwy
- 8191 Nc Hwy 90 E
- 8191 E Hwy 90 None
- 8117 Us Highway 64 90 W
- 8117 Hwy 90 E
- 8134 Nc Hwy 90 E
- 10 Price Ct
- 88 Bennett Rd
- 88 Bennett Rd
- 105 Bennett Rd
- 83 Springfield Dr
- 8098 Us Highway 64 90 W
- 106 Bennett Rd
- 0000 Bennett Rd
- 130 Bennett Rd
- 130 Bennett Rd