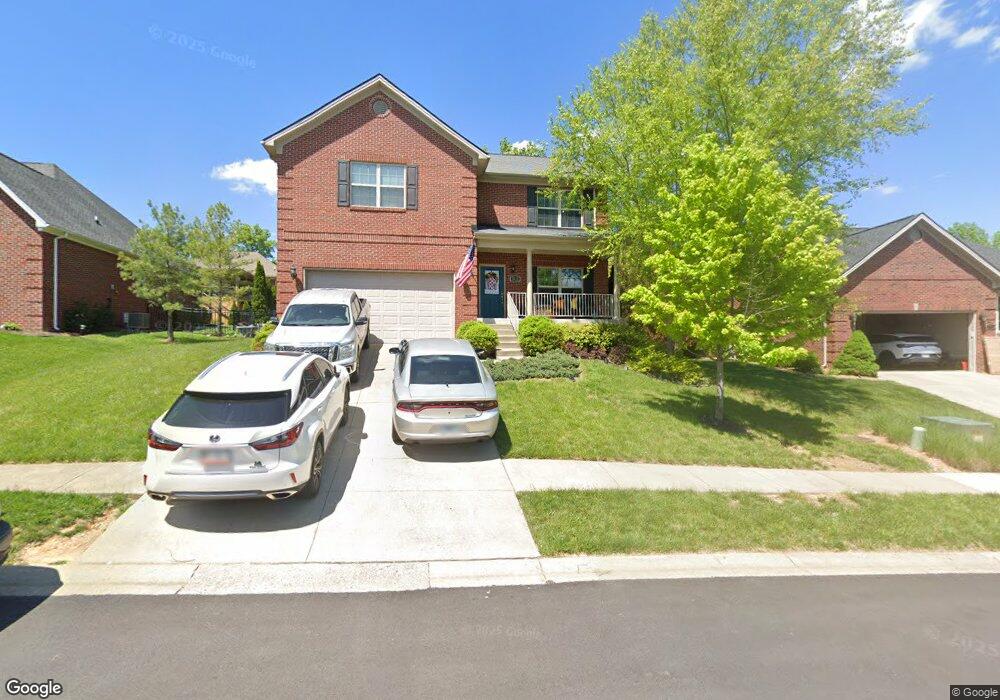
8171 Autumn Dr Georgetown, IN 47122
Estimated Value: $389,000 - $465,000
4
Beds
4
Baths
3,636
Sq Ft
$117/Sq Ft
Est. Value
About This Home
This home is located at 8171 Autumn Dr, Georgetown, IN 47122 and is currently estimated at $424,575, approximately $116 per square foot. 8171 Autumn Dr is a home located in Floyd County with nearby schools including Georgetown Elementary School, Highland Hills Middle School, and Floyd Central High School.
Ownership History
Date
Name
Owned For
Owner Type
Purchase Details
Closed on
Aug 12, 2011
Sold by
Fannie Mae
Bought by
Lyninger Richard D
Current Estimated Value
Home Financials for this Owner
Home Financials are based on the most recent Mortgage that was taken out on this home.
Original Mortgage
$140,000
Outstanding Balance
$96,979
Interest Rate
4.58%
Mortgage Type
VA
Estimated Equity
$327,596
Purchase Details
Closed on
Nov 12, 2010
Sold by
Jenney Carles A and Jenney Lauren M
Bought by
Federal National Mortgage Association
Purchase Details
Closed on
Jun 20, 2007
Sold by
Schuler Company Inc
Bought by
Jenney Charles A and Jenney Lauren M
Home Financials for this Owner
Home Financials are based on the most recent Mortgage that was taken out on this home.
Original Mortgage
$197,520
Interest Rate
6.37%
Mortgage Type
New Conventional
Create a Home Valuation Report for This Property
The Home Valuation Report is an in-depth analysis detailing your home's value as well as a comparison with similar homes in the area
Home Values in the Area
Average Home Value in this Area
Purchase History
| Date | Buyer | Sale Price | Title Company |
|---|---|---|---|
| Lyninger Richard D | -- | Executive Title Company | |
| Federal National Mortgage Association | -- | None Available | |
| Jenney Charles A | -- | Land Title Group Llc | |
| The Schuler Company Inc | -- | Land Title Group Llc |
Source: Public Records
Mortgage History
| Date | Status | Borrower | Loan Amount |
|---|---|---|---|
| Open | Lyninger Richard D | $140,000 | |
| Previous Owner | The Schuler Company Inc | $197,520 | |
| Previous Owner | Jenney Charles A | $49,380 |
Source: Public Records
Tax History Compared to Growth
Tax History
| Year | Tax Paid | Tax Assessment Tax Assessment Total Assessment is a certain percentage of the fair market value that is determined by local assessors to be the total taxable value of land and additions on the property. | Land | Improvement |
|---|---|---|---|---|
| 2024 | $2,501 | $312,300 | $29,500 | $282,800 |
| 2023 | $2,764 | $321,800 | $29,500 | $292,300 |
| 2022 | $2,930 | $318,200 | $29,500 | $288,700 |
| 2021 | $2,688 | $297,800 | $29,500 | $268,300 |
| 2020 | $2,680 | $302,400 | $29,500 | $272,900 |
| 2019 | $2,507 | $293,700 | $29,500 | $264,200 |
| 2018 | $2,598 | $295,100 | $29,500 | $265,600 |
| 2017 | $2,264 | $258,500 | $29,500 | $229,000 |
| 2016 | $2,140 | $259,600 | $29,500 | $230,100 |
| 2014 | $2,617 | $277,300 | $36,400 | $240,900 |
| 2013 | -- | $239,900 | $36,400 | $203,500 |
Source: Public Records
Map
Nearby Homes
- 8890 High St
- 1115 Marci Ln
- 7003- LOT 970 Mitsch Ln
- 6614 State Road 64 Vacant Land
- 7005- LOT 969 Mitsch Ln
- 7006- LOT 920 Mitsch Ln
- 6015 Addison Springs Ct
- 8048 Hudson Ln
- 9180 Robin Rd
- 8031 Hudson Ln
- 8027 Hudson Ln
- 8058 Hudson Ln
- 1236 Walts Rd
- 1232 Walts Rd
- 9410 Wolfe Cemetery Rd
- 1036 Brookstone Ct
- 1034 Brookstone Ct
- 1027 Brookstone Ct
- 1026 Brookstone Ct
- 7014 Dylan Cir
- 8173 Autumn Dr
- 8135 Autumn Dr
- 8133 Autumn Dr
- 8137 Autumn Dr
- 8184 Autumn Dr
- 8182 Autumn Dr
- 8139 Autumn Dr
- 8167 Autumn Dr
- 0 Lot #38 Autumn Dr
- 0 Lot #39 Autumn Dr
- 0 Lot #4 Autumn Dr
- 0 Lot #2 Autumn Dr
- 0 Lot #3 Autumn Dr
- 0 Lot #1 Autumn Dr
- 8132 Autumn Dr
- 8130 Autumn Dr
- 8134 Autumn Dr
- 8141 Autumn Dr
- 8180 Autumn Dr
- 8127 Autumn Dr