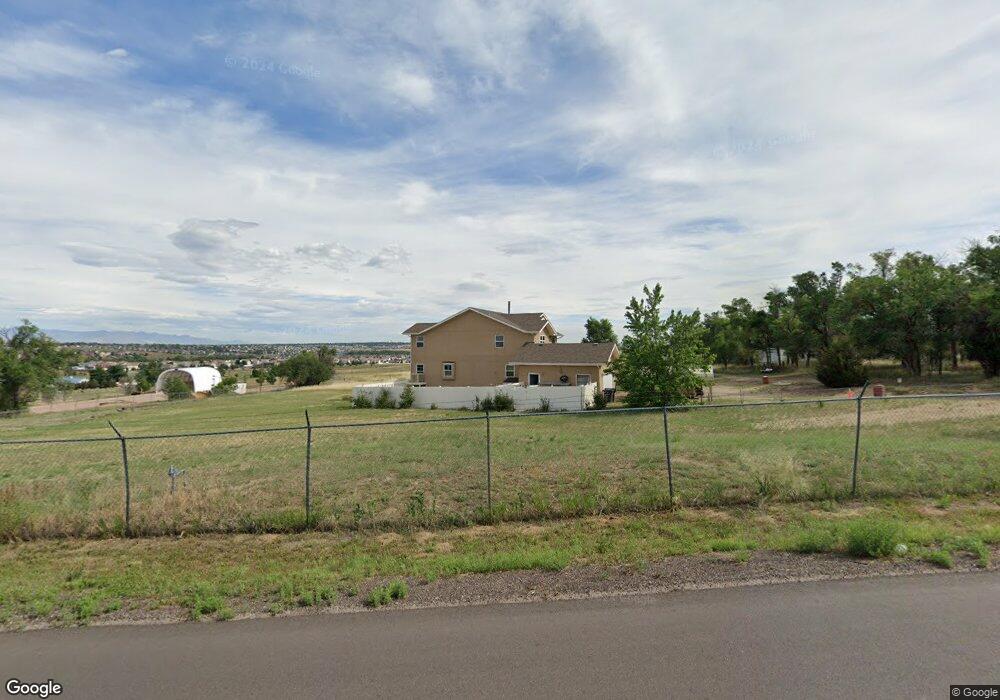
8171 Ermel Rd Fountain, CO 80817
Central Fountain Valley NeighborhoodEstimated Value: $551,000 - $705,000
4
Beds
4
Baths
3,233
Sq Ft
$199/Sq Ft
Est. Value
About This Home
This home is located at 8171 Ermel Rd, Fountain, CO 80817 and is currently estimated at $643,965, approximately $199 per square foot. 8171 Ermel Rd is a home located in El Paso County with nearby schools including Jordahl Elementary School, Fountain Middle School, and Fountain-Fort Carson High School.
Ownership History
Date
Name
Owned For
Owner Type
Purchase Details
Closed on
Aug 7, 2009
Sold by
North Susan
Bought by
Mitchell Michael Kenneth and Mitchell Susan
Current Estimated Value
Home Financials for this Owner
Home Financials are based on the most recent Mortgage that was taken out on this home.
Original Mortgage
$385,000
Outstanding Balance
$252,300
Interest Rate
5.31%
Mortgage Type
VA
Estimated Equity
$391,665
Purchase Details
Closed on
Apr 30, 2001
Sold by
George Ann
Bought by
North Susan
Purchase Details
Closed on
Oct 12, 1989
Bought by
Mitchell Susan
Purchase Details
Closed on
May 26, 1976
Bought by
Mitchell Susan
Purchase Details
Closed on
Oct 29, 1975
Bought by
Mitchell Michael Kenneth
Purchase Details
Closed on
Feb 11, 1975
Bought by
Mitchell Michael Kenneth
Purchase Details
Closed on
Dec 13, 1963
Bought by
Mitchell Michael Kenneth
Create a Home Valuation Report for This Property
The Home Valuation Report is an in-depth analysis detailing your home's value as well as a comparison with similar homes in the area
Home Values in the Area
Average Home Value in this Area
Purchase History
| Date | Buyer | Sale Price | Title Company |
|---|---|---|---|
| Mitchell Michael Kenneth | -- | None Available | |
| North Susan | -- | -- | |
| Mitchell Susan | -- | -- | |
| Mitchell Susan | -- | -- | |
| Mitchell Michael Kenneth | -- | -- | |
| Mitchell Michael Kenneth | -- | -- | |
| Mitchell Michael Kenneth | -- | -- |
Source: Public Records
Mortgage History
| Date | Status | Borrower | Loan Amount |
|---|---|---|---|
| Open | Mitchell Michael Kenneth | $385,000 |
Source: Public Records
Tax History Compared to Growth
Tax History
| Year | Tax Paid | Tax Assessment Tax Assessment Total Assessment is a certain percentage of the fair market value that is determined by local assessors to be the total taxable value of land and additions on the property. | Land | Improvement |
|---|---|---|---|---|
| 2025 | $2,119 | $41,240 | -- | -- |
| 2024 | $1,573 | $42,010 | $9,650 | $32,360 |
| 2022 | $1,526 | $36,150 | $8,300 | $27,850 |
| 2021 | $1,411 | $37,190 | $8,540 | $28,650 |
| 2020 | $1,346 | $35,510 | $7,460 | $28,050 |
| 2019 | $1,326 | $35,510 | $7,460 | $28,050 |
| 2018 | $1,364 | $28,410 | $7,160 | $21,250 |
| 2017 | $1,355 | $28,410 | $7,160 | $21,250 |
| 2016 | $1,334 | $27,900 | $7,390 | $20,510 |
| 2015 | $1,342 | $27,900 | $7,390 | $20,510 |
| 2014 | $1,267 | $26,540 | $7,390 | $19,150 |
Source: Public Records
Map
Nearby Homes
- 10617 Darneal Dr
- 8170 Watchmen Rd
- 9767 Carnival Ln
- 9749 Lackawanna St
- Juniper Plan at Aspen Ranch
- Boxelder Plan at Aspen Ranch
- Balsam Plan at Aspen Ranch
- Fir Plan at Aspen Ranch
- Olive Plan at Aspen Ranch
- Lilac Plan at Aspen Ranch
- Elm Plan at Aspen Ranch
- 9729 Lackawanna St
- 7860 Lantern Ln
- 9719 Lackawanna St
- 9791 Blaurock Dr
- 9709 Lackawanna St
- 8045 Firecracker Trail
- 8321 Firecracker Trail
- 9673 Pinpoint Dr
- 12 Arrow H Rd