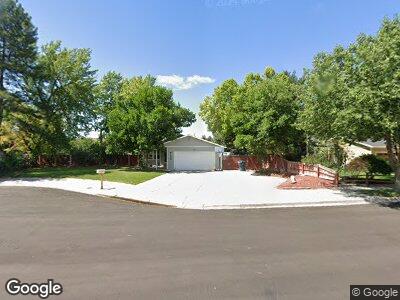
8172 Marion Cir Sandy, UT 84094
White City NeighborhoodEstimated Value: $594,000 - $636,000
4
Beds
3
Baths
2,548
Sq Ft
$240/Sq Ft
Est. Value
About This Home
This home is located at 8172 Marion Cir, Sandy, UT 84094 and is currently estimated at $610,495, approximately $239 per square foot. 8172 Marion Cir is a home located in Salt Lake County with nearby schools including East Sandy School, Union Middle School, and Hillcrest High School.
Ownership History
Date
Name
Owned For
Owner Type
Purchase Details
Closed on
Mar 23, 2020
Sold by
Fry Mark A
Bought by
Fry Mark
Current Estimated Value
Home Financials for this Owner
Home Financials are based on the most recent Mortgage that was taken out on this home.
Original Mortgage
$335,266
Interest Rate
2.75%
Mortgage Type
FHA
Purchase Details
Closed on
Mar 22, 2018
Sold by
Fry Mark A and Fry Meghan A
Bought by
Fry Mark A
Home Financials for this Owner
Home Financials are based on the most recent Mortgage that was taken out on this home.
Original Mortgage
$298,381
Interest Rate
4.75%
Mortgage Type
FHA
Purchase Details
Closed on
Aug 23, 2006
Sold by
Langford Scott E and Langford Judith A
Bought by
Fry Mark A and Fry Meghan A
Home Financials for this Owner
Home Financials are based on the most recent Mortgage that was taken out on this home.
Original Mortgage
$51,314
Interest Rate
6.7%
Mortgage Type
Stand Alone Second
Create a Home Valuation Report for This Property
The Home Valuation Report is an in-depth analysis detailing your home's value as well as a comparison with similar homes in the area
Home Values in the Area
Average Home Value in this Area
Purchase History
| Date | Buyer | Sale Price | Title Company |
|---|---|---|---|
| Fry Mark | -- | Meridian Title | |
| Fry Mark A | -- | First American Title Ins | |
| Fry Mark A | -- | First American Title |
Source: Public Records
Mortgage History
| Date | Status | Borrower | Loan Amount |
|---|---|---|---|
| Open | Fry Mark | $125,000 | |
| Closed | Fry Mark | $25,000 | |
| Open | Fry Mark | $348,800 | |
| Closed | Fry Mark | $335,266 | |
| Closed | Fry Mark A | $322,954 | |
| Closed | Fry Mark A | $298,381 | |
| Closed | Fry Mark A | $25,155 | |
| Closed | Fry Mark A | $281,053 | |
| Closed | Fry Mark A | $277,988 | |
| Closed | Fry Mark A | $273,880 | |
| Closed | Fry Mark A | $271,169 | |
| Closed | Fry Mark A | $51,314 | |
| Closed | Fry Mark A | $205,256 |
Source: Public Records
Tax History Compared to Growth
Tax History
| Year | Tax Paid | Tax Assessment Tax Assessment Total Assessment is a certain percentage of the fair market value that is determined by local assessors to be the total taxable value of land and additions on the property. | Land | Improvement |
|---|---|---|---|---|
| 2023 | $3,170 | $583,900 | $156,100 | $427,800 |
| 2022 | $2,949 | $531,200 | $153,000 | $378,200 |
| 2021 | $2,469 | $377,900 | $118,900 | $259,000 |
| 2020 | $2,389 | $345,000 | $118,900 | $226,100 |
| 2019 | $2,296 | $322,900 | $112,200 | $210,700 |
| 2018 | $2,134 | $313,000 | $112,200 | $200,800 |
| 2017 | $1,946 | $272,500 | $112,200 | $160,300 |
| 2016 | $1,924 | $260,300 | $112,200 | $148,100 |
| 2015 | $1,971 | $247,400 | $135,100 | $112,300 |
| 2014 | $1,814 | $223,500 | $123,700 | $99,800 |
Source: Public Records
Map
Nearby Homes
- 8159 Marion Cir
- 807 E 8230 S
- 760 E 8080 S
- 781 E 8270 S
- 8200 S 865 E
- 8093 S 615 E
- 629 E 8100 S
- 8079 S 615 E
- 645 E Stonefly Dr
- 870 E Vics Rd
- 7818 S Ponderosa Way
- 635 Pioneer Ave
- 411 E Bradley Way
- 8560 S 700 E
- 8538 Littlewood Cir
- 547 E Pioneer Ave
- 931 E 7800 S
- 327 Eaglebrook Dr
- 7996 S Showcase Ln
- 8017 S Showcase Ln
- 8172 Marion Cir
- 8158 S Marion Cir
- 8158 Marion Cir
- 8182 Marion Cir
- 9023 S 770 E
- 8167 S 740 E
- 8179 S 740 E
- 8158 S 740 E
- 8157 S 740 E
- 8157 S 740 E Unit 106
- 8186 S Marion Cir
- 8186 Marion Cir
- 8148 Marion Cir
- 8148 S Marion Cir
- 8189 S 740 E
- 8168 S 740 E Unit 4
- 8171 S Marion Cir
- 8171 Marion Cir
- 8171 S Marion Cir
- 8147 S 740 E