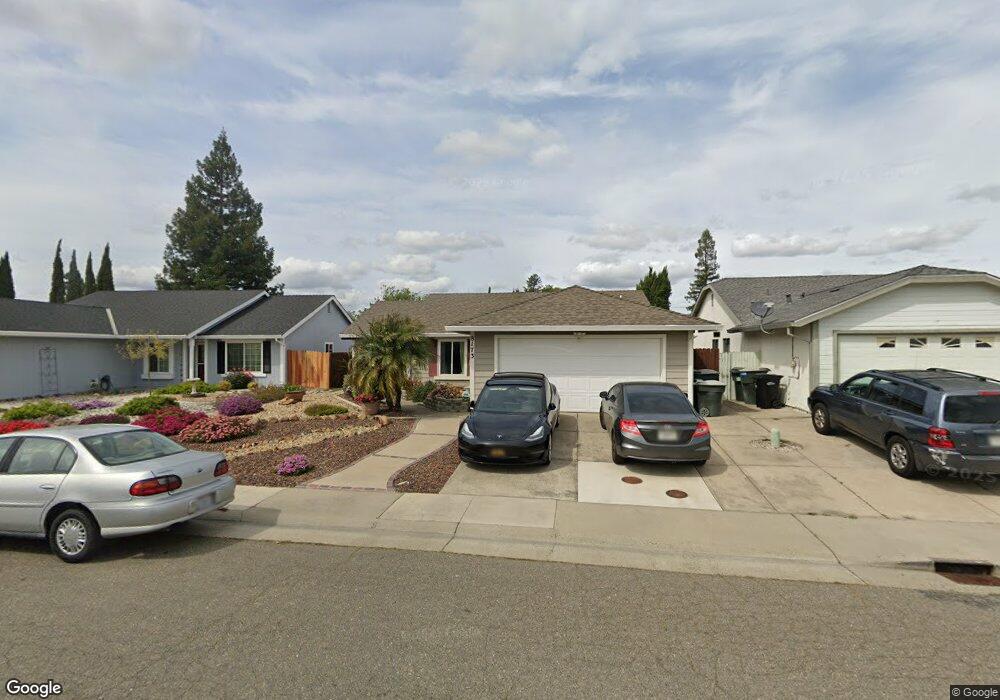
8173 Visalia Way Sacramento, CA 95828
Estimated Value: $361,000 - $470,000
3
Beds
2
Baths
1,353
Sq Ft
$324/Sq Ft
Est. Value
About This Home
This home is located at 8173 Visalia Way, Sacramento, CA 95828 and is currently estimated at $437,788, approximately $323 per square foot. 8173 Visalia Way is a home located in Sacramento County with nearby schools including Isabelle Jackson Elementary School, James Rutter Middle School, and Florin High School.
Ownership History
Date
Name
Owned For
Owner Type
Purchase Details
Closed on
Mar 28, 2017
Sold by
Kirkland A Dolphus and Kirkland Janet Marie
Bought by
Kirkland A Dolphus and Kirkland Janet Marie
Current Estimated Value
Purchase Details
Closed on
Jan 6, 2017
Sold by
Kirkland A Dolphus and Kirkland Janet Marie
Bought by
Kirkland A Dolphus and Kirkland Janet Marie
Home Financials for this Owner
Home Financials are based on the most recent Mortgage that was taken out on this home.
Original Mortgage
$170,445
Interest Rate
4.08%
Mortgage Type
VA
Purchase Details
Closed on
May 18, 2012
Sold by
Kirkland Janet Marie and Dolphus Kirkland A
Bought by
Kirkland A Dolphus and Kirkland Janet Marie
Home Financials for this Owner
Home Financials are based on the most recent Mortgage that was taken out on this home.
Original Mortgage
$136,900
Interest Rate
3.86%
Mortgage Type
New Conventional
Create a Home Valuation Report for This Property
The Home Valuation Report is an in-depth analysis detailing your home's value as well as a comparison with similar homes in the area
Home Values in the Area
Average Home Value in this Area
Purchase History
| Date | Buyer | Sale Price | Title Company |
|---|---|---|---|
| Kirkland A Dolphus | -- | None Available | |
| Kirkland A Dolphus | -- | North American Title Company | |
| Kirkland A Dolphus | -- | None Available |
Source: Public Records
Mortgage History
| Date | Status | Borrower | Loan Amount |
|---|---|---|---|
| Closed | Kirkland A Dolphus | $170,445 | |
| Closed | Kirkland A Dolphus | $136,900 |
Source: Public Records
Tax History Compared to Growth
Tax History
| Year | Tax Paid | Tax Assessment Tax Assessment Total Assessment is a certain percentage of the fair market value that is determined by local assessors to be the total taxable value of land and additions on the property. | Land | Improvement |
|---|---|---|---|---|
| 2025 | $2,714 | $243,544 | $88,398 | $155,146 |
| 2024 | $2,714 | $238,769 | $86,665 | $152,104 |
| 2023 | $2,648 | $234,088 | $84,966 | $149,122 |
| 2022 | $2,604 | $229,499 | $83,300 | $146,199 |
| 2021 | $2,576 | $225,000 | $81,667 | $143,333 |
| 2020 | $2,543 | $222,694 | $80,830 | $141,864 |
| 2019 | $2,498 | $218,329 | $79,246 | $139,083 |
| 2018 | $2,433 | $214,049 | $77,693 | $136,356 |
| 2017 | $2,392 | $209,853 | $76,170 | $133,683 |
| 2016 | $2,277 | $205,739 | $74,677 | $131,062 |
| 2015 | $2,236 | $202,650 | $73,556 | $129,094 |
| 2014 | $2,200 | $198,682 | $72,116 | $126,566 |
Source: Public Records
Map
Nearby Homes
- 8186 Gustine Way
- 8251 Apple Cove Ct
- 8077 Goran Ct
- 7905 Springarden Way
- 8336 Cutler Way
- 8317 Honeycomb Way
- 7901 Stevenson Ave
- 8095 E Stockton Blvd
- 8346 Floxtree Ct
- 8012 Northern Oak Cir
- 4.13 ACR Lenhart Rd
- 8437 Yermo Way
- 8266 Summer Sunset Dr
- 7715 Cotton Ln
- 8282 Union Creek Way
- 7711 Lenhart Rd
- 8336 Summer Sunset Dr
- 0 Rangeview Ln
- 8045 Arroyo Vista Dr
- 8205 Weyburn Ct
- 8177 Visalia Way
- 8156 Scenic Hills Way
- 8181 Visalia Way
- 8165 Visalia Way
- 8160 Scenic Hills Way
- 8148 Scenic Hills Way
- 8164 Scenic Hills Way
- 8170 Visalia Way
- 8183 Visalia Way
- 8161 Visalia Way
- 8166 Visalia Way
- 8180 Visalia Way
- 8144 Scenic Hills Way
- 8168 Scenic Hills Way
- 8162 Visalia Way
- 8187 Visalia Way
- 8182 Visalia Way
- 8157 Visalia Way
- 8174 Heather Grove Ct
- 8140 Scenic Hills Way