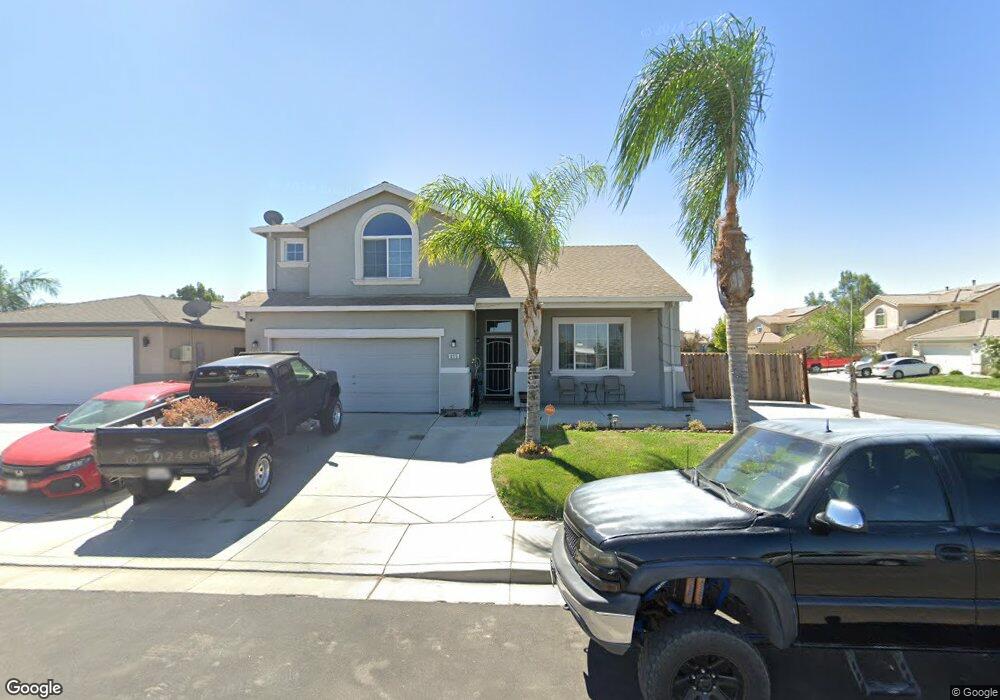
8175 W Eli Ct Dos Palos, CA 93620
Estimated Value: $230,000 - $398,169
4
Beds
3
Baths
1,890
Sq Ft
$180/Sq Ft
Est. Value
About This Home
This home is located at 8175 W Eli Ct, Dos Palos, CA 93620 and is currently estimated at $340,792, approximately $180 per square foot. 8175 W Eli Ct is a home located in Merced County with nearby schools including Dos Palos Elementary School, Bernhard Marks Elementary School, and Bryant Middle School.
Ownership History
Date
Name
Owned For
Owner Type
Purchase Details
Closed on
Jun 13, 2025
Sold by
Lira Jose D and Lira Jose
Bought by
Lira Jose D and Hernandez Guadalupe T
Current Estimated Value
Home Financials for this Owner
Home Financials are based on the most recent Mortgage that was taken out on this home.
Original Mortgage
$307,692
Outstanding Balance
$306,894
Interest Rate
6.76%
Mortgage Type
FHA
Estimated Equity
$33,898
Purchase Details
Closed on
Aug 23, 2019
Sold by
Lira Jose D and Lira Jose D
Bought by
Lira Jose D and Lira Jose
Home Financials for this Owner
Home Financials are based on the most recent Mortgage that was taken out on this home.
Original Mortgage
$246,489
Interest Rate
4.5%
Mortgage Type
FHA
Purchase Details
Closed on
Sep 26, 2008
Sold by
K Hovnanian Forecast Homes Northern Inc
Bought by
Lira Jose D
Home Financials for this Owner
Home Financials are based on the most recent Mortgage that was taken out on this home.
Original Mortgage
$175,650
Interest Rate
6.49%
Mortgage Type
FHA
Create a Home Valuation Report for This Property
The Home Valuation Report is an in-depth analysis detailing your home's value as well as a comparison with similar homes in the area
Home Values in the Area
Average Home Value in this Area
Purchase History
| Date | Buyer | Sale Price | Title Company |
|---|---|---|---|
| Lira Jose D | -- | First American Title | |
| Lira Jose D | -- | First American Title Company | |
| Lira Jose D | $178,000 | Orange Coast Title Company |
Source: Public Records
Mortgage History
| Date | Status | Borrower | Loan Amount |
|---|---|---|---|
| Open | Lira Jose D | $307,692 | |
| Previous Owner | Lira Jose D | $246,489 | |
| Previous Owner | Lira Jose D | $175,650 |
Source: Public Records
Tax History Compared to Growth
Tax History
| Year | Tax Paid | Tax Assessment Tax Assessment Total Assessment is a certain percentage of the fair market value that is determined by local assessors to be the total taxable value of land and additions on the property. | Land | Improvement |
|---|---|---|---|---|
| 2025 | $2,539 | $233,659 | $52,533 | $181,126 |
| 2024 | $2,539 | $229,078 | $51,503 | $177,575 |
| 2023 | $2,459 | $224,588 | $50,494 | $174,094 |
| 2022 | $2,359 | $220,185 | $49,504 | $170,681 |
| 2021 | $2,360 | $215,869 | $48,534 | $167,335 |
| 2020 | $2,335 | $213,657 | $48,037 | $165,620 |
| 2019 | $2,295 | $209,469 | $47,096 | $162,373 |
| 2018 | $2,244 | $205,363 | $46,173 | $159,190 |
| 2017 | $2,201 | $201,337 | $45,268 | $156,069 |
| 2016 | $2,165 | $197,390 | $44,381 | $153,009 |
| 2015 | $1,872 | $169,000 | $30,000 | $139,000 |
| 2014 | $1,574 | $141,000 | $30,000 | $111,000 |
Source: Public Records
Map
Nearby Homes
- 21627 State Highway 33
- 21477 Reynolds Ave
- 21188 Elgin Ave
- 2021 Madera Ave
- 0 Christian Ave Unit MC25192664
- 0 Christian Ave Unit MC25192705
- 0 Christian Ave Unit MC25192693
- 0 Christian Ave Unit MC25192654
- 37 Christian Ave
- 1951 McDonald Ave
- 0 W Almond St Unit MC25192737
- 18808 Reynolds Ave
- 1725 California Ave
- 1734 Golden Gate Ave
- 1830 Valeria St
- 2373 Olive St
- 1410 Frank Ave
- 2525 Linden St
- 8979 Almond Ave
- 1333 Frank Ave
- 8163 W Eli Ct
- 21582 S Eli Ave
- 8166 W Forecast Dr
- 8151 W Eli Ct
- 21563 S Eli Ave
- 21577 S Eli Ave
- 21551 S Eli Ave
- 8154 W Forecast Dr
- 8176 W Eli Ct
- 8164 W Eli Ct
- 21585 S Eli Ave
- 21539 S Eli Ave
- 8142 W Forecast Dr
- 8152 W Eli Ct
- 21593 S Eli Ave
- 8137 W Eli Ct
- 21525 S Eli Ave
- 8132 W Eli Ct
- 8179 W Christian Ave
- 8138 W Eli Ct