8176 Gordon Green Buena Park, CA 90621
Estimated Value: $728,991 - $797,000
4
Beds
3
Baths
1,560
Sq Ft
$489/Sq Ft
Est. Value
About This Home
This home is located at 8176 Gordon Green, Buena Park, CA 90621 and is currently estimated at $762,248, approximately $488 per square foot. 8176 Gordon Green is a home located in Orange County with nearby schools including Charles G. Emery Elementary School, Buena Park Junior High School, and Sunny Hills High School.
Ownership History
Date
Name
Owned For
Owner Type
Purchase Details
Closed on
Mar 22, 2021
Sold by
Vora Ketki
Bought by
Vora Ketki and Vora Raj B
Current Estimated Value
Home Financials for this Owner
Home Financials are based on the most recent Mortgage that was taken out on this home.
Original Mortgage
$357,500
Outstanding Balance
$320,636
Interest Rate
2.73%
Mortgage Type
New Conventional
Estimated Equity
$441,612
Purchase Details
Closed on
Feb 21, 1996
Sold by
Kennedy David G and Kennedy Janice K
Bought by
Vora Bhupendra D and Vora Ketki Bhupendra
Home Financials for this Owner
Home Financials are based on the most recent Mortgage that was taken out on this home.
Original Mortgage
$117,800
Interest Rate
6.98%
Purchase Details
Closed on
Sep 16, 1993
Sold by
Kennedy David G and Kennedy Janice K
Bought by
Kennedy David G and Kennedy Janice K
Create a Home Valuation Report for This Property
The Home Valuation Report is an in-depth analysis detailing your home's value as well as a comparison with similar homes in the area
Home Values in the Area
Average Home Value in this Area
Purchase History
| Date | Buyer | Sale Price | Title Company |
|---|---|---|---|
| Vora Ketki | -- | Wfg National Title Co Of Ca | |
| Vora Bhupendra D | $124,000 | Orange Coast Title Co | |
| Kennedy David G | -- | -- |
Source: Public Records
Mortgage History
| Date | Status | Borrower | Loan Amount |
|---|---|---|---|
| Open | Vora Ketki | $357,500 | |
| Closed | Vora Bhupendra D | $117,800 |
Source: Public Records
Tax History Compared to Growth
Tax History
| Year | Tax Paid | Tax Assessment Tax Assessment Total Assessment is a certain percentage of the fair market value that is determined by local assessors to be the total taxable value of land and additions on the property. | Land | Improvement |
|---|---|---|---|---|
| 2025 | $2,499 | $205,980 | $100,427 | $105,553 |
| 2024 | $2,499 | $201,942 | $98,458 | $103,484 |
| 2023 | $2,443 | $197,983 | $96,528 | $101,455 |
| 2022 | $2,400 | $194,101 | $94,635 | $99,466 |
| 2021 | $2,380 | $190,296 | $92,780 | $97,516 |
| 2020 | $2,350 | $188,345 | $91,828 | $96,517 |
| 2019 | $2,297 | $184,652 | $90,027 | $94,625 |
| 2018 | $2,253 | $181,032 | $88,262 | $92,770 |
| 2017 | $2,220 | $177,483 | $86,532 | $90,951 |
| 2016 | $2,176 | $174,003 | $84,835 | $89,168 |
| 2015 | $2,087 | $171,390 | $83,561 | $87,829 |
| 2014 | $2,151 | $168,033 | $81,924 | $86,109 |
Source: Public Records
Map
Nearby Homes
- 8244 Henderson Green
- 4738 Durango Dr
- 5211 Fox Hills Ave
- 4900 Lincolnshire Ave
- 5412 Arrowhead Ave
- 8237 Henshaw Cir
- 14806 Faceta Dr
- 14828 Rayfield Dr
- 14724 Mercado Ave
- 15213 Santa Gertrudes Ave Unit W106
- 2150 Cheyenne Way Unit 169
- 15233 Santa Gertrudes Ave
- 5588 Cajon Ave
- 15220 Ocaso Ave Unit H103
- 15224 Ocaso Ave Unit H212
- 8542 Emerywood Dr
- 2200 Cheyenne Way Unit 117
- 15011 La Mesa Dr
- 9 Coveside Ct
- 14727 La Mesa Dr
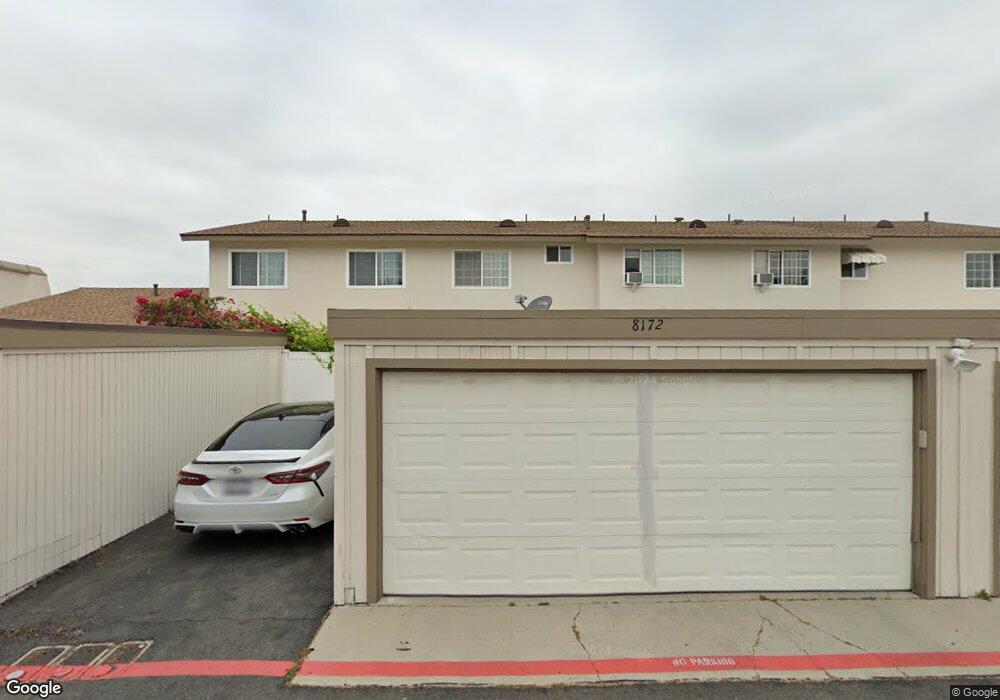
- 8172 Gordon Green
- 8180 Gordon Green
- 8168 Gordon Green
- 8184 Gordon Green
- 8162 Gordon Green
- 8188 Gordon Green
- 8158 Hunter Green
- 8192 Gordon Green
- 8177 Gordon Green
- 8181 Gordon Green
- 8154 Hunter Green
- 8185 Gordon Green
- 5067 Argyle Dr
- 8198 Gordon Green
- 5071 Argyle Dr
- 8189 Gordon Green
- 5063 Argyle Dr
- 8150 Hunter Green
- 8193 Gordon Green
- 5075 Argyle Dr