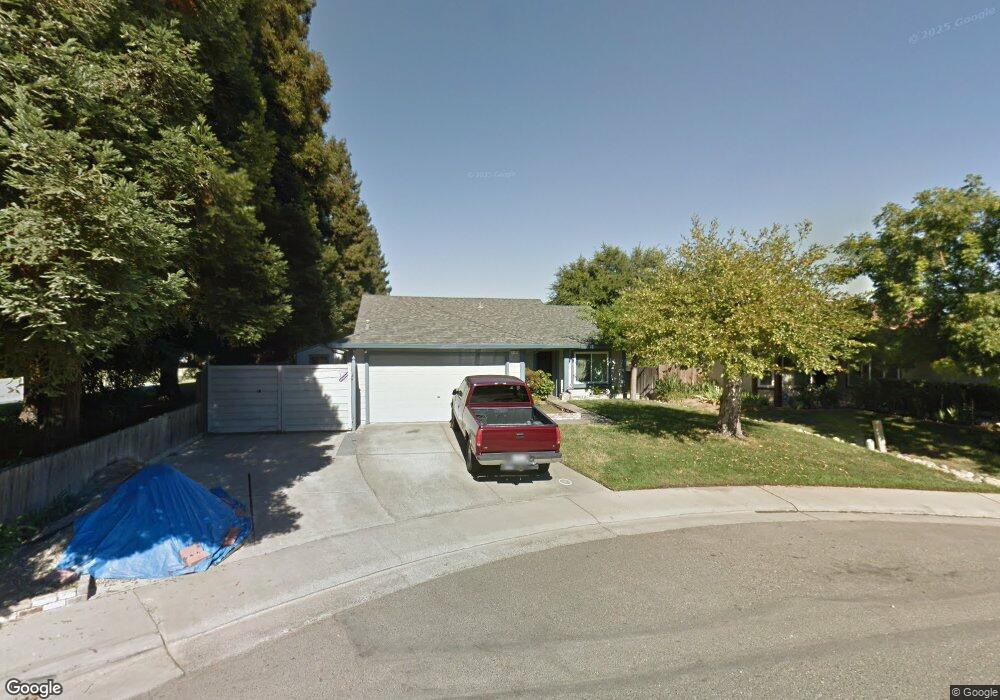
8178 Sonoma Hills Way Sacramento, CA 95828
Estimated Value: $486,000 - $506,000
3
Beds
2
Baths
1,443
Sq Ft
$343/Sq Ft
Est. Value
About This Home
This home is located at 8178 Sonoma Hills Way, Sacramento, CA 95828 and is currently estimated at $495,415, approximately $343 per square foot. 8178 Sonoma Hills Way is a home located in Sacramento County with nearby schools including Isabelle Jackson Elementary School, James Rutter Middle School, and Florin High School.
Ownership History
Date
Name
Owned For
Owner Type
Purchase Details
Closed on
Mar 28, 2005
Sold by
Baldauf Nancy L
Bought by
Freedom Guilherme Joseph and Freedom Guilherme
Current Estimated Value
Home Financials for this Owner
Home Financials are based on the most recent Mortgage that was taken out on this home.
Original Mortgage
$276,000
Outstanding Balance
$135,154
Interest Rate
5%
Mortgage Type
New Conventional
Estimated Equity
$360,261
Purchase Details
Closed on
Jun 15, 1997
Sold by
Johnson M Jerome and Johnson Pauline R
Bought by
Baldauf Nancy L
Home Financials for this Owner
Home Financials are based on the most recent Mortgage that was taken out on this home.
Original Mortgage
$99,000
Interest Rate
7.94%
Purchase Details
Closed on
May 24, 1996
Sold by
Rountree John Emerson and Rountree Marsha Lee
Bought by
Johnson M Jerome and Johnson Pauline R
Create a Home Valuation Report for This Property
The Home Valuation Report is an in-depth analysis detailing your home's value as well as a comparison with similar homes in the area
Home Values in the Area
Average Home Value in this Area
Purchase History
| Date | Buyer | Sale Price | Title Company |
|---|---|---|---|
| Freedom Guilherme Joseph | $345,000 | Financial Title Company | |
| Baldauf Nancy L | $110,000 | Chicago Title Co | |
| Johnson M Jerome | $107,500 | Fidelity National Title Co |
Source: Public Records
Mortgage History
| Date | Status | Borrower | Loan Amount |
|---|---|---|---|
| Open | Freedom Guilherme Joseph | $276,000 | |
| Previous Owner | Baldauf Nancy L | $99,000 | |
| Closed | Freedom Guilherme Joseph | $69,000 |
Source: Public Records
Tax History Compared to Growth
Tax History
| Year | Tax Paid | Tax Assessment Tax Assessment Total Assessment is a certain percentage of the fair market value that is determined by local assessors to be the total taxable value of land and additions on the property. | Land | Improvement |
|---|---|---|---|---|
| 2025 | $5,177 | $480,883 | $125,443 | $355,440 |
| 2024 | $5,177 | $471,455 | $122,984 | $348,471 |
| 2023 | $5,046 | $462,212 | $120,573 | $341,639 |
| 2022 | $4,959 | $453,150 | $118,209 | $334,941 |
| 2021 | $3,985 | $357,718 | $93,315 | $264,403 |
| 2020 | $3,535 | $316,565 | $82,580 | $233,985 |
| 2019 | $3,318 | $295,856 | $77,178 | $218,678 |
| 2018 | $3,172 | $284,478 | $74,210 | $210,268 |
| 2017 | $2,981 | $265,869 | $69,356 | $196,513 |
| 2016 | $2,687 | $246,176 | $64,219 | $181,957 |
| 2015 | $2,449 | $223,797 | $58,381 | $165,416 |
| 2014 | $2,326 | $211,129 | $55,076 | $156,053 |
Source: Public Records
Map
Nearby Homes
- 8216 Exbourne Cir
- 8233 Short Rd
- 8159 Morgan Hill Way
- 8437 Yermo Way
- 8170 Derbyshire Cir
- 8247 Derbyshire Cir
- 8447 Cassatt Way
- 8578 Hydrangea Ct
- 8510 Cavendish Way
- 8772 Crusheen Way
- 8336 Cutler Way
- 8716 Cord Way
- 8329 Spengler Dr
- 8317 Honeycomb Way
- 8548 Whitby Ct
- 8836 Inisheer Way
- 8034 Kelty Ct
- 8831 Liscarney Way
- 8346 Floxtree Ct
- 8762 Lemas Rd
- 8174 Sonoma Hills Way
- 8179 Madonna Ct
- 8170 Sonoma Hills Way
- 8175 Madonna Ct
- 8201 Sonoma Hills Way
- 8565 Flannery Way
- 8166 Sonoma Hills Way
- 8171 Madonna Ct
- 8205 Sonoma Hills Way
- 8600 Luciano Ct
- 8201 Orelli Ct
- 8561 Flannery Way
- 8562 Flannery Way
- 8604 Luciano Ct
- 8205 Orelli Ct
- 8209 Sonoma Hills Way
- 8558 Flannery Way
- 8582 Flannery Way
- 8174 Madonna Ct
- 8170 Madonna Ct