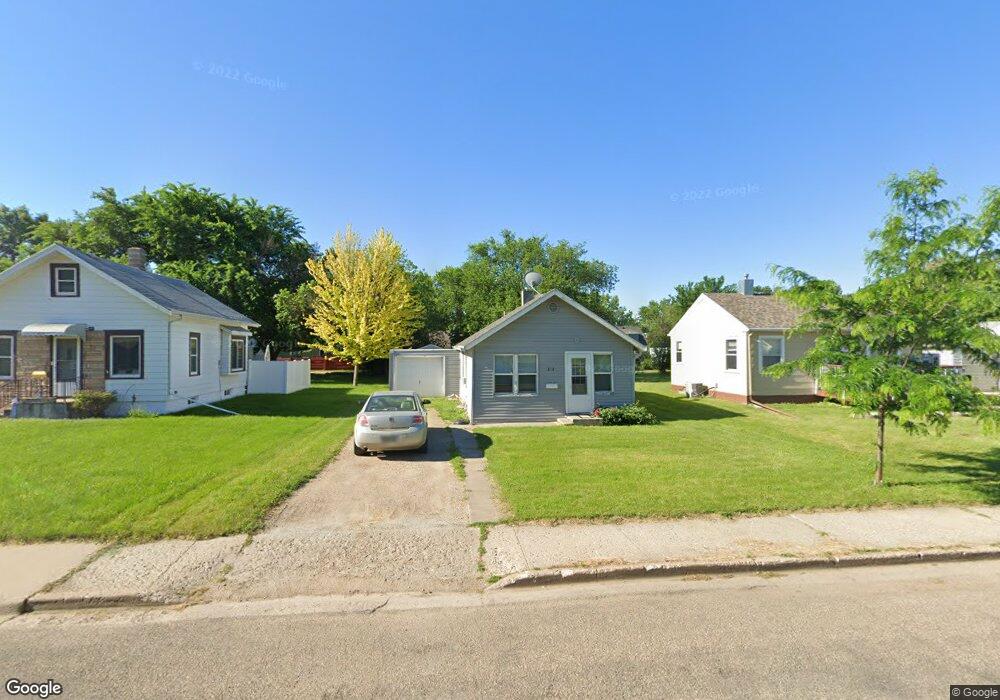
818 11th Ave SE Aberdeen, SD 57401
Estimated Value: $99,038 - $197,000
2
Beds
1
Bath
919
Sq Ft
$152/Sq Ft
Est. Value
About This Home
This home is located at 818 11th Ave SE, Aberdeen, SD 57401 and is currently estimated at $140,010, approximately $152 per square foot. 818 11th Ave SE is a home with nearby schools including May Overby Elementary School, Simmons Middle School, and Central High School.
Ownership History
Date
Name
Owned For
Owner Type
Purchase Details
Closed on
Jun 22, 2007
Sold by
Frink Joel P and Frink Stacey D
Bought by
Malsam Jon
Current Estimated Value
Home Financials for this Owner
Home Financials are based on the most recent Mortgage that was taken out on this home.
Original Mortgage
$43,316
Outstanding Balance
$26,391
Interest Rate
6.2%
Mortgage Type
Unknown
Estimated Equity
$113,619
Create a Home Valuation Report for This Property
The Home Valuation Report is an in-depth analysis detailing your home's value as well as a comparison with similar homes in the area
Home Values in the Area
Average Home Value in this Area
Purchase History
| Date | Buyer | Sale Price | Title Company |
|---|---|---|---|
| Malsam Jon | $42,000 | None Available |
Source: Public Records
Mortgage History
| Date | Status | Borrower | Loan Amount |
|---|---|---|---|
| Open | Malsam Jon | $43,316 |
Source: Public Records
Tax History Compared to Growth
Tax History
| Year | Tax Paid | Tax Assessment Tax Assessment Total Assessment is a certain percentage of the fair market value that is determined by local assessors to be the total taxable value of land and additions on the property. | Land | Improvement |
|---|---|---|---|---|
| 2025 | $1,228 | $65,988 | $16,000 | $49,988 |
| 2024 | $1,228 | $61,194 | $13,750 | $47,444 |
| 2023 | $1,107 | $57,156 | $13,750 | $43,406 |
| 2022 | $1,031 | $52,185 | $13,750 | $38,435 |
| 2021 | $1,069 | $47,215 | $13,750 | $33,465 |
| 2020 | $1,008 | $48,534 | $13,750 | $34,784 |
| 2019 | $1,000 | $46,176 | $13,750 | $32,426 |
| 2018 | $906 | $44,997 | $13,750 | $31,247 |
| 2017 | -- | $42,638 | $13,750 | $28,888 |
| 2016 | -- | $42,638 | $13,750 | $28,888 |
| 2015 | -- | $42,638 | $13,750 | $28,888 |
| 2014 | -- | $40,660 | $11,000 | $29,660 |
| 2011 | -- | $37,118 | $0 | $0 |
Source: Public Records
Map
Nearby Homes
- 925 S Penn St
- 909 S Lloyd St
- 701 9th Ave SE
- 902 Cochrane St S
- 1526 S Dakota St
- 704 S Harrison St
- 112 S Arch St
- 1502 S Grant St
- 811 S Washington St
- 1608 12th Ave SE
- 1612 NE 12th Ave
- 1602 NE 12th Ave
- 1003 S Lawson St
- 307 S Congress St
- 802 S Merton St
- 405 S Jay St
- 302 S Harrison St
- 1701 NW 15th Ave
- 1761 Melody Ln
- 1301 S 1st St
- 822 11th Ave SE
- 814 11th Ave SE
- 828 11th Ave SE
- 810 11th Ave SE
- 1108 S Dakota St
- 817 12th Ave SE
- 809 12th Ave SE
- 802 11th Ave SE
- 821 12th Ave SE
- 813 12th Ave SE
- 1108 S Pennsylvania St
- 805 12th Ave SE
- 1024 S Dakota St
- 801 12th Ave SE
- 1118 S Pennsylvania St
- 1018 S Dakota St
- 814 12th Ave SE
- 723 11th Ave SE
- 1016 S Pennsylvania St
- 1108 S Penn St