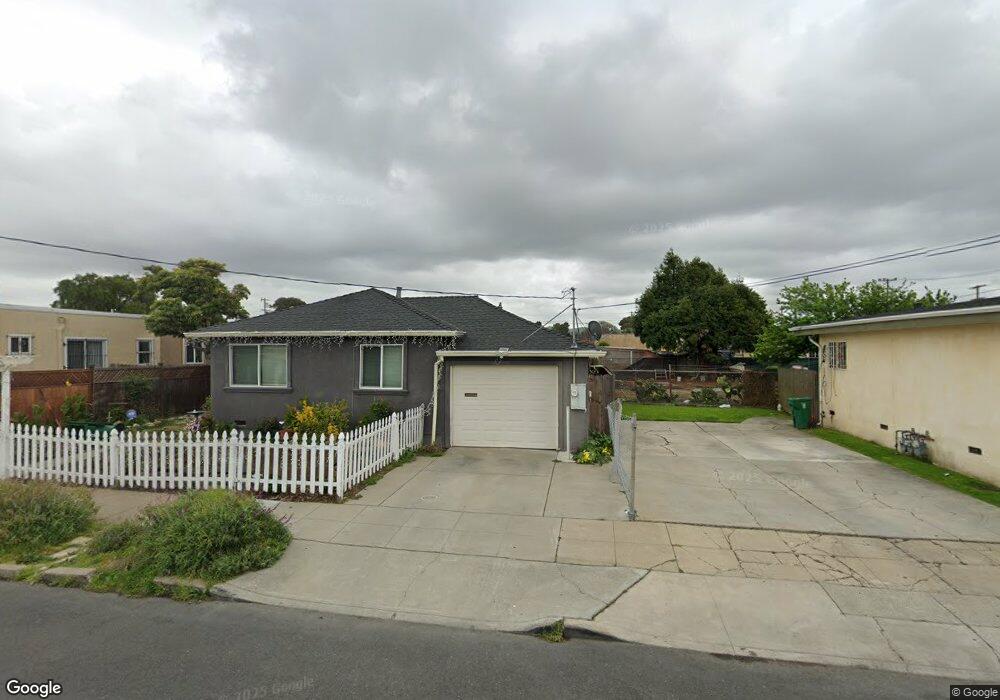
818 8th St Richmond, CA 94801
Iron Triangle NeighborhoodEstimated Value: $475,496 - $541,000
3
Beds
1
Bath
1,006
Sq Ft
$504/Sq Ft
Est. Value
About This Home
This home is located at 818 8th St, Richmond, CA 94801 and is currently estimated at $507,374, approximately $504 per square foot. 818 8th St is a home located in Contra Costa County with nearby schools including Peres Elementary School, Walter T. Helms Middle School, and Richmond High School.
Ownership History
Date
Name
Owned For
Owner Type
Purchase Details
Closed on
Aug 14, 2009
Sold by
Deutsche Bank National Trust Company
Bought by
Guerrero Dilia and Godinez Sandra
Current Estimated Value
Purchase Details
Closed on
Apr 10, 2008
Sold by
Jones Zachary
Bought by
Deutsche Bank National Trust Co
Purchase Details
Closed on
Aug 4, 2006
Sold by
Johnson James and Jones Deborah
Bought by
Jones Zachary
Home Financials for this Owner
Home Financials are based on the most recent Mortgage that was taken out on this home.
Original Mortgage
$320,000
Interest Rate
7.6%
Mortgage Type
Purchase Money Mortgage
Create a Home Valuation Report for This Property
The Home Valuation Report is an in-depth analysis detailing your home's value as well as a comparison with similar homes in the area
Home Values in the Area
Average Home Value in this Area
Purchase History
| Date | Buyer | Sale Price | Title Company |
|---|---|---|---|
| Guerrero Dilia | $45,500 | Lsi Title Agency Inc | |
| Deutsche Bank National Trust Co | $339,120 | Cr Title Services Inc | |
| Jones Zachary | $400,000 | Alliance Title Company |
Source: Public Records
Mortgage History
| Date | Status | Borrower | Loan Amount |
|---|---|---|---|
| Previous Owner | Jones Zachary | $320,000 |
Source: Public Records
Tax History
| Year | Tax Paid | Tax Assessment Tax Assessment Total Assessment is a certain percentage of the fair market value that is determined by local assessors to be the total taxable value of land and additions on the property. | Land | Improvement |
|---|---|---|---|---|
| 2025 | $2,225 | $58,719 | $25,809 | $32,910 |
| 2024 | $2,190 | $57,568 | $25,303 | $32,265 |
| 2023 | $2,190 | $56,440 | $24,807 | $31,633 |
| 2022 | $2,107 | $55,334 | $24,321 | $31,013 |
| 2021 | $2,036 | $54,250 | $23,845 | $30,405 |
| 2019 | $1,894 | $52,643 | $23,139 | $29,504 |
| 2018 | $1,815 | $51,612 | $22,686 | $28,926 |
| 2017 | $1,749 | $50,601 | $22,242 | $28,359 |
| 2016 | $1,684 | $49,609 | $21,806 | $27,803 |
| 2015 | $1,638 | $48,865 | $21,479 | $27,386 |
| 2014 | $1,632 | $47,909 | $21,059 | $26,850 |
Source: Public Records
Map
Nearby Homes
Your Personal Tour Guide
Ask me questions while you tour the home.