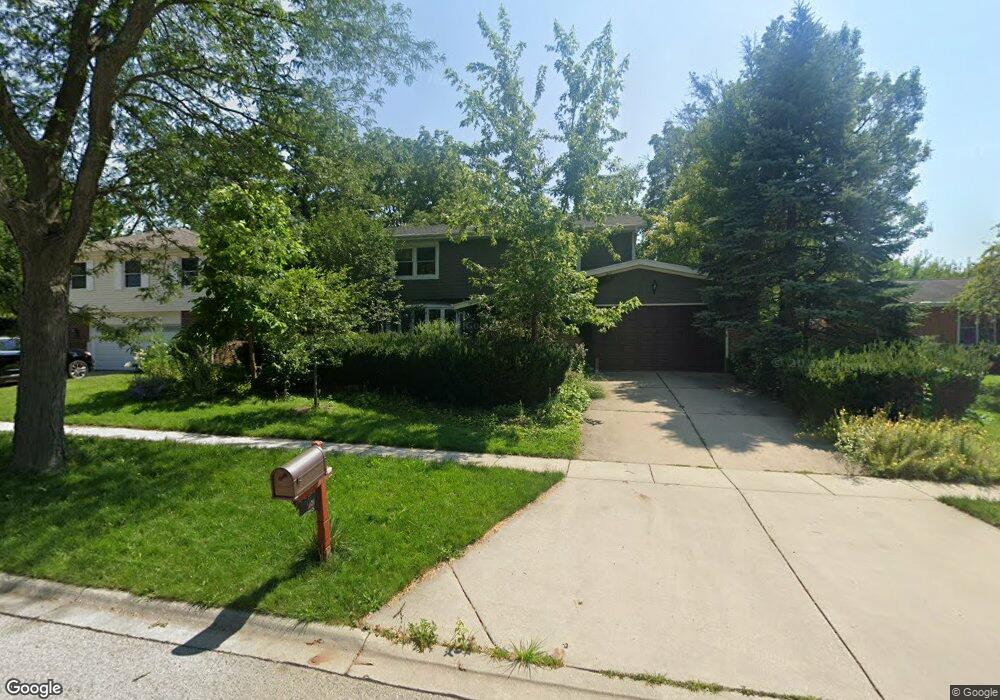
818 Braemar Dr Mundelein, IL 60060
Loch Lomond NeighborhoodEstimated Value: $428,000 - $454,000
4
Beds
3
Baths
2,232
Sq Ft
$197/Sq Ft
Est. Value
About This Home
This home is located at 818 Braemar Dr, Mundelein, IL 60060 and is currently estimated at $440,663, approximately $197 per square foot. 818 Braemar Dr is a home located in Lake County with nearby schools including Mechanics Grove Elementary School, Washington Early Learning Center, and Carl Sandburg Middle School.
Ownership History
Date
Name
Owned For
Owner Type
Purchase Details
Closed on
Jan 10, 2001
Sold by
Koptev Georgiv and Koptev Irina
Bought by
Koptev Georgiy and Kopteva Irina
Current Estimated Value
Home Financials for this Owner
Home Financials are based on the most recent Mortgage that was taken out on this home.
Original Mortgage
$235,300
Outstanding Balance
$84,043
Interest Rate
7.1%
Estimated Equity
$356,620
Purchase Details
Closed on
Jul 26, 2000
Sold by
Kamka David C and Kamka Anne M
Bought by
Koptev Georgiy and Koptev Irina
Home Financials for this Owner
Home Financials are based on the most recent Mortgage that was taken out on this home.
Original Mortgage
$235,600
Interest Rate
8.27%
Purchase Details
Closed on
Jan 15, 1999
Sold by
Allison Karen K and Hinrichsen Karen K
Bought by
Kamka David C and Kamka Anne M
Home Financials for this Owner
Home Financials are based on the most recent Mortgage that was taken out on this home.
Original Mortgage
$143,800
Interest Rate
6.75%
Create a Home Valuation Report for This Property
The Home Valuation Report is an in-depth analysis detailing your home's value as well as a comparison with similar homes in the area
Home Values in the Area
Average Home Value in this Area
Purchase History
| Date | Buyer | Sale Price | Title Company |
|---|---|---|---|
| Koptev Georgiy | -- | -- | |
| Koptev Georgiy | $248,000 | Mid America Title Company | |
| Kamka David C | $224,000 | -- |
Source: Public Records
Mortgage History
| Date | Status | Borrower | Loan Amount |
|---|---|---|---|
| Open | Koptev Georgiy | $235,300 | |
| Closed | Koptev Georgiy | $235,600 | |
| Previous Owner | Kamka David C | $143,800 |
Source: Public Records
Tax History Compared to Growth
Tax History
| Year | Tax Paid | Tax Assessment Tax Assessment Total Assessment is a certain percentage of the fair market value that is determined by local assessors to be the total taxable value of land and additions on the property. | Land | Improvement |
|---|---|---|---|---|
| 2024 | $11,258 | $124,430 | $13,264 | $111,166 |
| 2023 | $11,614 | $114,009 | $12,153 | $101,856 |
| 2022 | $11,614 | $113,963 | $14,010 | $99,953 |
| 2021 | $11,114 | $109,971 | $13,519 | $96,452 |
| 2020 | $10,936 | $106,945 | $13,147 | $93,798 |
| 2019 | $10,588 | $103,429 | $12,715 | $90,714 |
| 2018 | $9,718 | $95,326 | $11,838 | $83,488 |
| 2017 | $9,597 | $92,325 | $11,465 | $80,860 |
| 2016 | $9,352 | $87,686 | $10,889 | $76,797 |
| 2015 | $9,123 | $82,203 | $10,208 | $71,995 |
| 2014 | $8,681 | $79,844 | $9,899 | $69,945 |
| 2012 | $8,250 | $80,553 | $9,987 | $70,566 |
Source: Public Records
Map
Nearby Homes
- 212 Londonderry Ct
- 742 N Lake St
- 522 W Park St
- 728 W Maple Ave
- 137 Racine Place
- 851 Glenview Ave
- 547 N Ridgemoor Ave
- 973 Highland Rd
- 1152 Aberdeen Ln
- 331 Plaza Cir
- 1285 Appleby Cir
- 1291 Banbury Rd
- 1304 Dunleer Dr
- 535 E Maple Ave
- 29746 U S 45
- 116 N Prairie Ave
- 1021 Wrens Gate
- 659 E Maple Ave
- 40 S Seymour Ave
- 312 N Shaddle Ave
- 812 Braemar Dr
- 824 Braemar Dr
- 824 Braemar Dr Unit 824
- 830 Braemar Dr
- 806 Braemar Dr
- 839 Braemar Dr
- 300 W Maple Ave
- 220 W Maple Ave
- 836 Braemar Dr
- 827 Braemar Dr
- 843 Braemar Dr
- 833 Braemar Dr
- 842 Braemar Dr
- 849 Braemar Dr
- 761 Beach Place
- 777 Beach Place
- 745 Beach Place
- 729 Beach Place
- 848 Braemar Dr
- 813 Beach Place