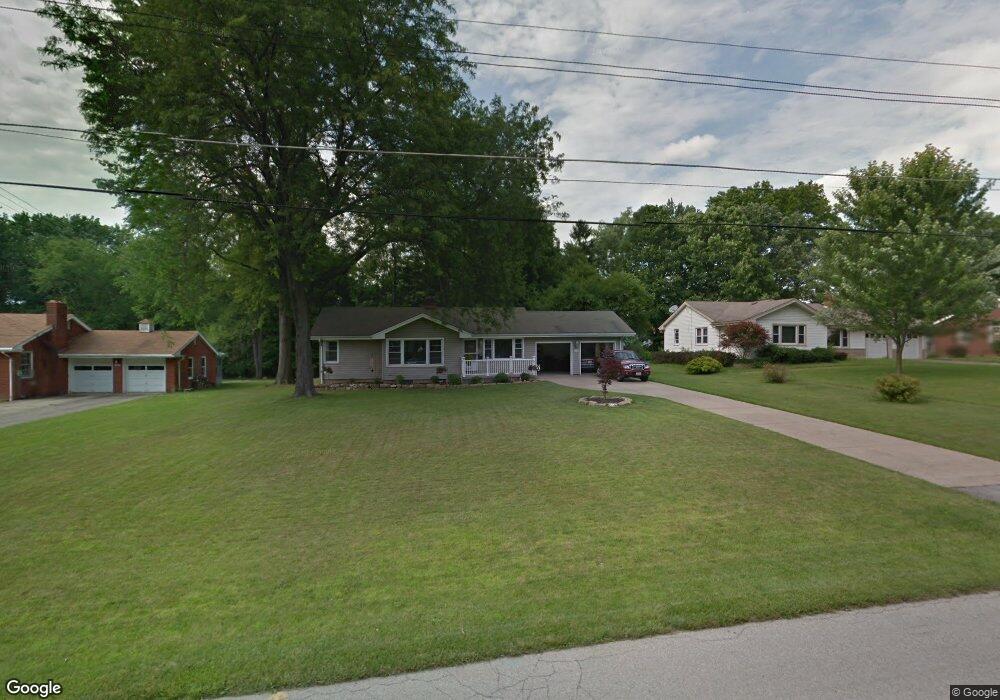
818 Brookfield Ave Youngstown, OH 44512
Estimated Value: $184,493 - $226,000
3
Beds
2
Baths
1,252
Sq Ft
$166/Sq Ft
Est. Value
About This Home
This home is located at 818 Brookfield Ave, Youngstown, OH 44512 and is currently estimated at $208,373, approximately $166 per square foot. 818 Brookfield Ave is a home located in Mahoning County with nearby schools including West Boulevard Elementary School, Boardman Center Middle School, and Boardman High School.
Ownership History
Date
Name
Owned For
Owner Type
Purchase Details
Closed on
May 6, 2010
Sold by
Haus Ronald E
Bought by
Mclaughlin Mary G
Current Estimated Value
Purchase Details
Closed on
Sep 11, 2008
Sold by
Tirpack Kenneth M and Murray Meagan M
Bought by
Haus Ronald E
Home Financials for this Owner
Home Financials are based on the most recent Mortgage that was taken out on this home.
Original Mortgage
$96,000
Interest Rate
4.85%
Mortgage Type
New Conventional
Purchase Details
Closed on
Mar 20, 2006
Sold by
Osborne Lorene E
Bought by
Tirpack Kenneth M and Murray Meagan M
Home Financials for this Owner
Home Financials are based on the most recent Mortgage that was taken out on this home.
Original Mortgage
$9,000
Interest Rate
6.33%
Mortgage Type
Credit Line Revolving
Purchase Details
Closed on
May 25, 2005
Sold by
Estate Of Jean Osborne
Bought by
Osborne Clyde
Create a Home Valuation Report for This Property
The Home Valuation Report is an in-depth analysis detailing your home's value as well as a comparison with similar homes in the area
Home Values in the Area
Average Home Value in this Area
Purchase History
| Date | Buyer | Sale Price | Title Company |
|---|---|---|---|
| Mclaughlin Mary G | $118,900 | Attorney | |
| Haus Ronald E | $120,000 | Attorney | |
| Tirpack Kenneth M | $95,000 | None Available | |
| Osborne Clyde | -- | -- |
Source: Public Records
Mortgage History
| Date | Status | Borrower | Loan Amount |
|---|---|---|---|
| Previous Owner | Haus Ronald E | $96,000 | |
| Previous Owner | Tirpack Kenneth M | $9,000 | |
| Previous Owner | Tirpack Kenneth M | $76,000 |
Source: Public Records
Tax History Compared to Growth
Tax History
| Year | Tax Paid | Tax Assessment Tax Assessment Total Assessment is a certain percentage of the fair market value that is determined by local assessors to be the total taxable value of land and additions on the property. | Land | Improvement |
|---|---|---|---|---|
| 2024 | $2,075 | $50,150 | $10,100 | $40,050 |
| 2023 | $2,078 | $50,150 | $10,100 | $40,050 |
| 2022 | $2,280 | $43,250 | $9,550 | $33,700 |
| 2021 | $2,282 | $43,250 | $9,550 | $33,700 |
| 2020 | $2,293 | $43,250 | $9,550 | $33,700 |
| 2019 | $2,179 | $37,610 | $8,300 | $29,310 |
| 2018 | $2,420 | $37,610 | $8,300 | $29,310 |
| 2017 | $2,389 | $37,610 | $8,300 | $29,310 |
| 2016 | $2,379 | $36,930 | $9,200 | $27,730 |
| 2015 | $2,332 | $36,930 | $9,200 | $27,730 |
| 2014 | -- | $36,930 | $9,200 | $27,730 |
| 2013 | $2,309 | $36,930 | $9,200 | $27,730 |
Source: Public Records
Map
Nearby Homes
- 813 Brookfield Ave
- 772 Ewing Rd
- 6632 Harrington Ave
- 768 Crestview Dr
- 6938 Ron Park Place
- 715 Crestview Dr
- 396 Brookfield Ave
- 0 Pinewood Dr Unit 5140025
- 6892 Glenwood Ave
- 242 Oakley Ave
- 7005 Paxton Rd
- 6723 Lockwood Blvd Unit 4
- 6747 Lockwood Blvd
- 7544 Jaguar Dr
- 7556 Jaguar Dr
- 6726 Glendale Ave
- 5670 Tracy Dr
- 1422 Turnberry Dr
- 6931 Lockwood Blvd
- 5200 West Blvd Unit 505
- 812 Brookfield Ave
- 824 Brookfield Ave
- 830 Brookfield Ave
- 804 Brookfield Ave
- 819 Ewing Rd
- 821 Ewing Rd
- 809 Ewing Rd
- 827 Ewing Rd
- 825 Brookfield Ave
- 836 Brookfield Ave
- 803 Ewing Rd
- 833 Ewing Rd
- 798 Brookfield Ave
- 805 Brookfield Ave
- 831 Brookfield Ave
- 841 Ewing Rd
- 842 Brookfield Ave
- 837 Brookfield Ave
- 795 Ewing Rd
- 799 Brookfield Ave