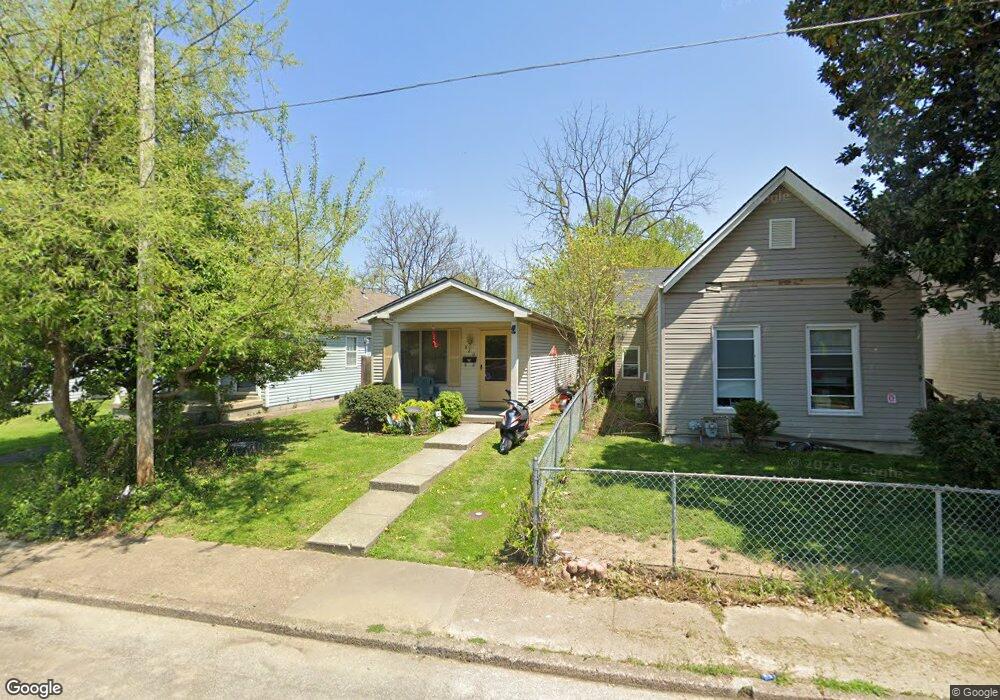
818 E 11th St New Albany, IN 47150
Estimated Value: $159,115 - $163,000
4
Beds
2
Baths
1,112
Sq Ft
$145/Sq Ft
Est. Value
About This Home
This home is located at 818 E 11th St, New Albany, IN 47150 and is currently estimated at $161,279, approximately $145 per square foot. 818 E 11th St is a home located in Floyd County with nearby schools including S. Ellen Jones Elementary School, Hazelwood Middle School, and New Albany Senior High School.
Ownership History
Date
Name
Owned For
Owner Type
Purchase Details
Closed on
Dec 13, 2019
Sold by
Mdm Management Llc
Bought by
Hope Swells Opportunity Fund Llc
Current Estimated Value
Purchase Details
Closed on
Sep 1, 2011
Sold by
Rakes Delbert
Bought by
Justin Glotzbach Properties Inc
Purchase Details
Closed on
Jun 13, 2008
Sold by
Us Bank National Association
Bought by
Rakes Delbert
Purchase Details
Closed on
Jan 10, 2008
Sold by
Thomas Tommy and Thomas Judy
Bought by
Us Bank National Association and Structured Asset Investment Loan Trust
Purchase Details
Closed on
Dec 12, 2005
Sold by
Sheffield Michael
Bought by
Thomas Tommy and Thomas Judy
Home Financials for this Owner
Home Financials are based on the most recent Mortgage that was taken out on this home.
Original Mortgage
$51,200
Interest Rate
6.48%
Mortgage Type
New Conventional
Create a Home Valuation Report for This Property
The Home Valuation Report is an in-depth analysis detailing your home's value as well as a comparison with similar homes in the area
Home Values in the Area
Average Home Value in this Area
Purchase History
| Date | Buyer | Sale Price | Title Company |
|---|---|---|---|
| Hope Swells Opportunity Fund Llc | -- | None Available | |
| Mdm Management Llc | -- | None Available | |
| Justin Glotzbach Properties Inc | -- | None Available | |
| Rakes Delbert | -- | None Available | |
| Us Bank National Association | $29,585 | None Available | |
| Thomas Tommy | -- | None Available |
Source: Public Records
Mortgage History
| Date | Status | Borrower | Loan Amount |
|---|---|---|---|
| Previous Owner | Thomas Tommy | $51,200 |
Source: Public Records
Tax History Compared to Growth
Tax History
| Year | Tax Paid | Tax Assessment Tax Assessment Total Assessment is a certain percentage of the fair market value that is determined by local assessors to be the total taxable value of land and additions on the property. | Land | Improvement |
|---|---|---|---|---|
| 2024 | $671 | $31,600 | $7,700 | $23,900 |
| 2023 | $743 | $34,800 | $7,700 | $27,100 |
| 2022 | $728 | $34,100 | $7,700 | $26,400 |
| 2021 | $633 | $29,400 | $7,700 | $21,700 |
| 2020 | $634 | $29,400 | $7,700 | $21,700 |
| 2019 | $634 | $29,400 | $7,700 | $21,700 |
| 2018 | $632 | $29,100 | $7,700 | $21,400 |
| 2017 | $798 | $29,200 | $7,700 | $21,500 |
| 2016 | $578 | $28,900 | $7,700 | $21,200 |
| 2014 | $492 | $24,600 | $7,800 | $16,800 |
| 2013 | -- | $23,900 | $7,700 | $16,200 |
Source: Public Records
Map
Nearby Homes
- 1119 Ekin Ave
- 1205 Ekin Ave
- 1120 Chartres St
- 830 Cedar Bough Place
- 1314 Ekin Ave
- 1313 Culbertson Ave
- 1314 Chartres St
- 1406 Chartres St
- 1412 Chartres St
- 416 E 11th St
- 1605 Culbertson Ave
- 1010 E Spring St
- 323 E 9th St
- 608 E Oak St
- 1011 Vincennes St Unit 5
- 335 E 15th St
- 336 E 16th St
- 1727 E Oak St
- 330 E 16th St
- 1619 King St
- 816 E 11th St
- 822 E 11th St
- 814 E 11th St
- 826 E 11th St
- 1110 Greenaway Place
- 810 E 11th St
- 1112 Greenaway Place
- 808 E 11th St
- 1111 Ekin Ave
- 1114 Greenaway Place Unit 1116
- 806 E 11th St
- 1113 Ekin Ave
- 902 E 11th St
- 1115 Ekin Ave
- 1118 Greenaway Place
- 1117 Ekin Ave
- 908 E 11th St
- 1109 Greenaway Place
- 1120 Greenaway Place
- 910 E 11th St