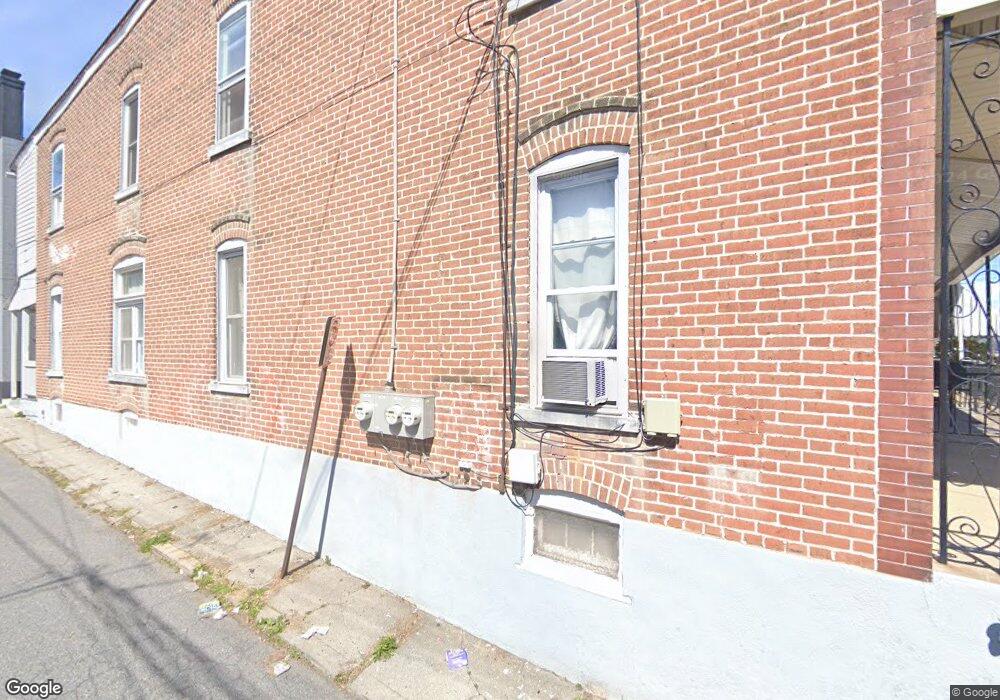
818 N 4th St Allentown, PA 18102
Center City NeighborhoodEstimated Value: $160,000 - $210,000
5
Beds
1
Bath
1,698
Sq Ft
$109/Sq Ft
Est. Value
About This Home
This home is located at 818 N 4th St, Allentown, PA 18102 and is currently estimated at $184,290, approximately $108 per square foot. 818 N 4th St is a home located in Lehigh County with nearby schools including Sheridan Elementary School, San Rafael Junior High School, and Trexler Middle School.
Ownership History
Date
Name
Owned For
Owner Type
Purchase Details
Closed on
Jan 21, 2022
Sold by
Miller Fred A
Bought by
Carcias Investments
Current Estimated Value
Purchase Details
Closed on
Feb 19, 2010
Sold by
Rhoads Philip G
Bought by
Milvac Properties
Purchase Details
Closed on
Feb 18, 2010
Sold by
Secy Of H U D
Bought by
Rhoads Philip G
Purchase Details
Closed on
Jun 23, 2006
Sold by
Mendez Carmen L and Mendez Dinora M
Bought by
Mendez Carmen L
Purchase Details
Closed on
Sep 9, 1998
Sold by
Ride Developers Lp
Bought by
Mendez Carmen L and Mendez Dinora M
Purchase Details
Closed on
Nov 18, 1997
Sold by
Security Pacific Financial Svcs Ca Inc
Bought by
Ride Developers Lp
Purchase Details
Closed on
May 20, 1997
Sold by
Rossi Ronald W
Bought by
Security Pacific Financial Svcs Ca Inc
Create a Home Valuation Report for This Property
The Home Valuation Report is an in-depth analysis detailing your home's value as well as a comparison with similar homes in the area
Home Values in the Area
Average Home Value in this Area
Purchase History
| Date | Buyer | Sale Price | Title Company |
|---|---|---|---|
| Carcias Investments | $35,000 | Premier Settlements Inc | |
| Milvac Properties | $37,000 | -- | |
| Rhoads Philip G | $37,000 | -- | |
| Mendez Carmen L | -- | None Available | |
| Mendez Carmen L | $55,000 | -- | |
| Ride Developers Lp | $22,000 | -- | |
| Security Pacific Financial Svcs Ca Inc | -- | -- |
Source: Public Records
Tax History Compared to Growth
Tax History
| Year | Tax Paid | Tax Assessment Tax Assessment Total Assessment is a certain percentage of the fair market value that is determined by local assessors to be the total taxable value of land and additions on the property. | Land | Improvement |
|---|---|---|---|---|
| 2025 | $2,262 | $70,100 | $5,100 | $65,000 |
| 2024 | $2,262 | $70,100 | $5,100 | $65,000 |
| 2023 | $2,262 | $70,100 | $5,100 | $65,000 |
| 2022 | $2,182 | $70,100 | $65,000 | $5,100 |
| 2021 | $2,138 | $70,100 | $5,100 | $65,000 |
| 2020 | $2,082 | $70,100 | $5,100 | $65,000 |
| 2019 | $2,048 | $70,100 | $5,100 | $65,000 |
| 2018 | $1,913 | $70,100 | $5,100 | $65,000 |
| 2017 | $1,865 | $70,100 | $5,100 | $65,000 |
| 2016 | -- | $70,100 | $5,100 | $65,000 |
| 2015 | -- | $70,100 | $5,100 | $65,000 |
| 2014 | -- | $70,100 | $5,100 | $65,000 |
Source: Public Records
Map
Nearby Homes
- 837 N Jordan St
- 415 W Cedar St
- 914 N 4th St
- 424 W Cedar St
- 423 W Washington St
- 833 N 5th St
- 438 W Green St
- 824 N 5th St
- 701 N Jordan St
- 431 Tilghman St
- 643 N 4th St
- 392 W Tilghman St
- 909 N 6th St
- 504 W Tilghman St
- 614 W Greenleaf St
- 1045 N 2nd St
- 626 W Cedar St
- 522 N Jordan St
- 172 W Green St
- 419 W Liberty St