
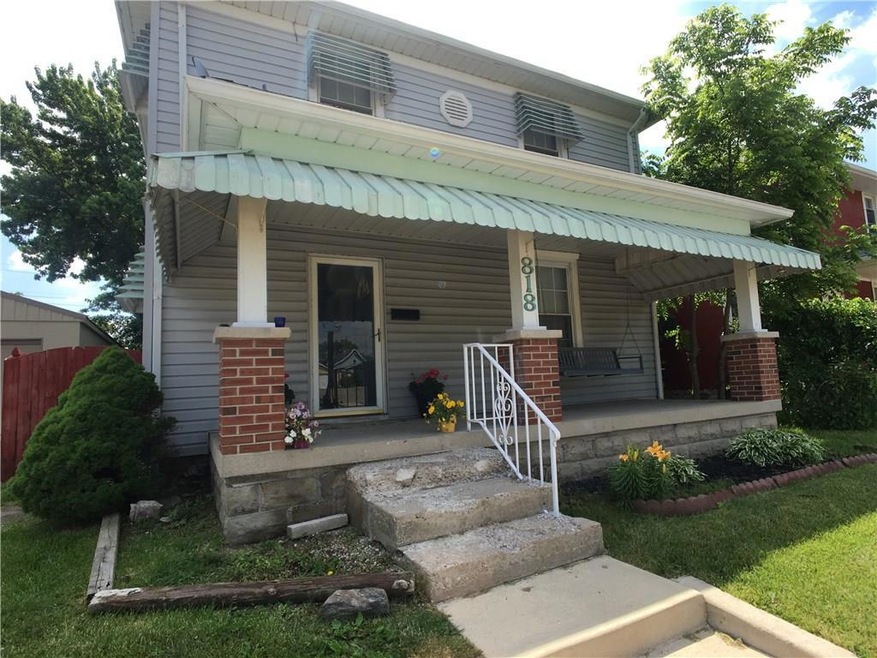
818 S 18th St New Castle, IN 47362
New Castle NeighborhoodEstimated Value: $63,000 - $112,657
3
Beds
1.5
Baths
1,974
Sq Ft
$42/Sq Ft
Est. Value
Highlights
- Traditional Architecture
- Corner Lot
- Covered patio or porch
- Wood Flooring
- No HOA
- 2-minute walk to Murphey Park
About This Home
As of October 2019Lots of possibilities with this property. The needs some TLC, but has 3 bedrooms, 1.5 baths, over 1,900 sq ft, and a 1 car detached garage.
Last Listed By
Matthew Huffman
F.C. Tucker/Crossroads Real Estate Listed on: 06/06/2019
Home Details
Home Type
- Single Family
Year Built
- Built in 1900
Lot Details
- 5,280 Sq Ft Lot
- Corner Lot
Parking
- 1 Car Detached Garage
Home Design
- Traditional Architecture
- Block Foundation
- Vinyl Siding
Interior Spaces
- 2-Story Property
- Vinyl Clad Windows
- Formal Dining Room
- Unfinished Basement
- Partial Basement
Flooring
- Wood
- Carpet
- Vinyl
Bedrooms and Bathrooms
- 3 Bedrooms
Outdoor Features
- Covered patio or porch
Utilities
- Window Unit Cooling System
- Forced Air Heating System
- Heating System Uses Gas
- Electric Water Heater
Community Details
- No Home Owners Association
Listing and Financial Details
- Tax Lot 269
- Assessor Parcel Number 331214310137000016
Ownership History
Date
Name
Owned For
Owner Type
Purchase Details
Listed on
Jun 6, 2019
Closed on
Sep 23, 2019
Sold by
Gold Jerry C and Gold Laura J
Bought by
Williams Jennifer
Seller's Agent
Matthew Huffman
F.C. Tucker/Crossroads Real Estate
Buyer's Agent
Matthew Huffman
F.C. Tucker/Crossroads Real Estate
List Price
$45,000
Sold Price
$37,000
Premium/Discount to List
-$8,000
-17.78%
Total Days on Market
82
Current Estimated Value
Home Financials for this Owner
Home Financials are based on the most recent Mortgage that was taken out on this home.
Estimated Appreciation
$45,664
Avg. Annual Appreciation
15.44%
Original Mortgage
$29,600
Outstanding Balance
$26,265
Interest Rate
3.6%
Mortgage Type
New Conventional
Estimated Equity
$56,399
Create a Home Valuation Report for This Property
The Home Valuation Report is an in-depth analysis detailing your home's value as well as a comparison with similar homes in the area
Similar Homes in New Castle, IN
Home Values in the Area
Average Home Value in this Area
Purchase History
| Date | Buyer | Sale Price | Title Company |
|---|---|---|---|
| Williams Jennifer | -- | None Available |
Source: Public Records
Mortgage History
| Date | Status | Borrower | Loan Amount |
|---|---|---|---|
| Open | Williams Jennifer | $29,600 |
Source: Public Records
Property History
| Date | Event | Price | Change | Sq Ft Price |
|---|---|---|---|---|
| 10/21/2019 10/21/19 | Sold | $37,000 | +5.7% | $19 / Sq Ft |
| 08/28/2019 08/28/19 | Pending | -- | -- | -- |
| 08/23/2019 08/23/19 | Price Changed | $35,000 | -12.3% | $18 / Sq Ft |
| 07/09/2019 07/09/19 | Price Changed | $39,900 | -11.3% | $20 / Sq Ft |
| 06/06/2019 06/06/19 | For Sale | $45,000 | -- | $23 / Sq Ft |
Source: MIBOR Broker Listing Cooperative®
Tax History Compared to Growth
Tax History
| Year | Tax Paid | Tax Assessment Tax Assessment Total Assessment is a certain percentage of the fair market value that is determined by local assessors to be the total taxable value of land and additions on the property. | Land | Improvement |
|---|---|---|---|---|
| 2024 | $484 | $53,200 | $7,600 | $45,600 |
| 2023 | $423 | $47,300 | $7,600 | $39,700 |
| 2022 | $411 | $41,100 | $7,600 | $33,500 |
| 2021 | $379 | $37,900 | $7,600 | $30,300 |
| 2020 | $396 | $36,800 | $7,600 | $29,200 |
| 2019 | $389 | $25,500 | $7,600 | $17,900 |
| 2018 | $528 | $25,300 | $7,600 | $17,700 |
| 2017 | $524 | $25,100 | $7,600 | $17,500 |
| 2016 | $515 | $24,700 | $7,600 | $17,100 |
| 2014 | $1,357 | $66,800 | $7,600 | $59,200 |
| 2013 | $1,357 | $64,100 | $7,600 | $56,500 |
Source: Public Records
Agents Affiliated with this Home
-
M
Seller's Agent in 2019
Matthew Huffman
F.C. Tucker/Crossroads Real Estate
49 in this area
94 Total Sales
Map
Source: MIBOR Broker Listing Cooperative®
MLS Number: 21645583
APN: 33-12-14-310-137.000-016
Disclaimer: Certain information contained herein is derived from information provided by parties other than Homes.com. All information provided is deemed reliable, but is not guaranteed to be accurate and should be independently verified.
![]() Based on information submitted to the MLS GRID. All data is obtained from various sources and may not have been verified by broker or MLS GRID. Supplied Open House Information is subject to change without notice. All information should be independently reviewed and verified for accuracy. Properties may or may not be listed by the office/agent presenting the information. Some IDX listings have been excluded from this website.
Based on information submitted to the MLS GRID. All data is obtained from various sources and may not have been verified by broker or MLS GRID. Supplied Open House Information is subject to change without notice. All information should be independently reviewed and verified for accuracy. Properties may or may not be listed by the office/agent presenting the information. Some IDX listings have been excluded from this website.
Nearby Homes