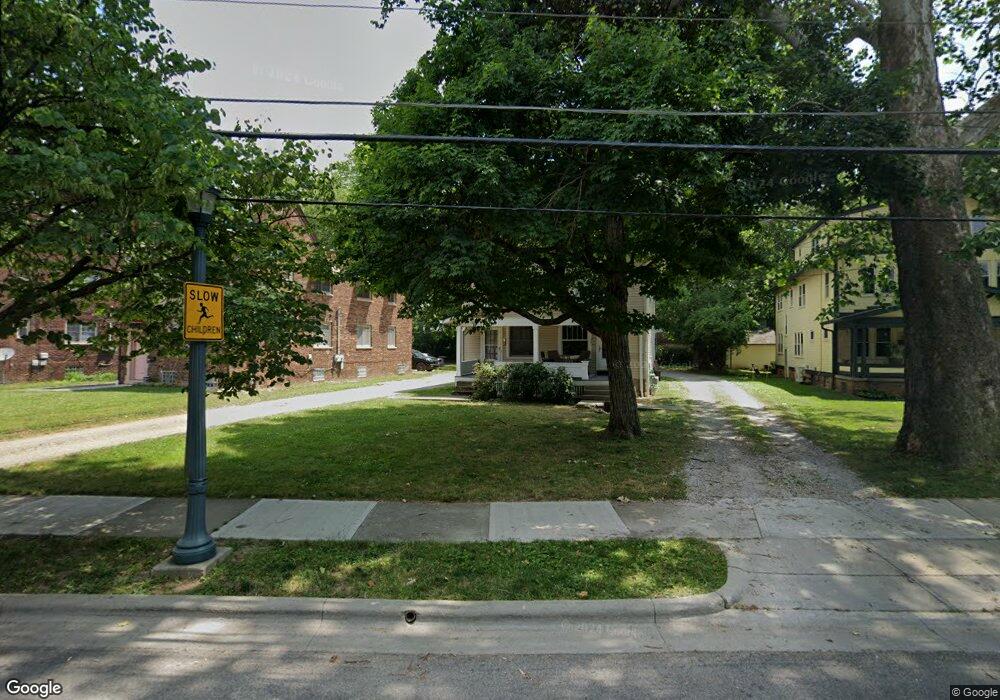
818 Sheridan Ave Unit 20 Columbus, OH 43209
Estimated Value: $394,255 - $454,000
6
Beds
2
Baths
2,520
Sq Ft
$166/Sq Ft
Est. Value
About This Home
This home is located at 818 Sheridan Ave Unit 20, Columbus, OH 43209 and is currently estimated at $419,314, approximately $166 per square foot. 818 Sheridan Ave Unit 20 is a home located in Franklin County with nearby schools including Montrose Elementary School, Bexley Middle School, and Bexley High School.
Ownership History
Date
Name
Owned For
Owner Type
Purchase Details
Closed on
Mar 27, 2023
Sold by
Edwards Cari C
Bought by
Carver Cynthia C
Current Estimated Value
Purchase Details
Closed on
Jan 28, 2002
Sold by
Chesney Paul O
Bought by
Chesney Paul O and Chesney Susan R
Purchase Details
Closed on
Mar 6, 2000
Sold by
Chesney Paul O and Chesney Mildred M
Bought by
Chesney Mildred M
Purchase Details
Closed on
Jul 11, 1967
Bought by
Chesney Paul O and Chesney Mildred
Create a Home Valuation Report for This Property
The Home Valuation Report is an in-depth analysis detailing your home's value as well as a comparison with similar homes in the area
Home Values in the Area
Average Home Value in this Area
Purchase History
| Date | Buyer | Sale Price | Title Company |
|---|---|---|---|
| Carver Cynthia C | $110,000 | Transfer Title Services Inc | |
| Chesney Paul O | -- | -- | |
| Chesney Mildred M | -- | -- | |
| Chesney Paul O | -- | -- | |
| Chesney Paul O | -- | -- |
Source: Public Records
Tax History Compared to Growth
Tax History
| Year | Tax Paid | Tax Assessment Tax Assessment Total Assessment is a certain percentage of the fair market value that is determined by local assessors to be the total taxable value of land and additions on the property. | Land | Improvement |
|---|---|---|---|---|
| 2024 | $7,257 | $117,010 | $38,920 | $78,090 |
| 2023 | $6,301 | $117,010 | $38,920 | $78,090 |
| 2022 | $5,297 | $78,190 | $18,130 | $60,060 |
| 2021 | $4,968 | $78,190 | $18,130 | $60,060 |
| 2020 | $4,925 | $78,190 | $18,130 | $60,060 |
| 2019 | $4,667 | $65,180 | $15,090 | $50,090 |
| 2018 | $4,162 | $65,180 | $15,090 | $50,090 |
| 2017 | $3,977 | $65,180 | $15,090 | $50,090 |
| 2016 | $4,240 | $63,490 | $16,380 | $47,110 |
| 2015 | $4,255 | $63,490 | $16,380 | $47,110 |
| 2014 | $4,280 | $63,490 | $16,380 | $47,110 |
| 2013 | $2,119 | $60,480 | $15,610 | $44,870 |
Source: Public Records
Map
Nearby Homes
- 866-868 Sheridan Ave
- 849 Lyman Ave
- 1000 S Dawson Ave Unit 302
- 782 S Remington Rd
- 905 Vernon Rd
- 891 Vernon Rd
- 2425 Bryden Rd
- 2350 Bryden Rd
- 419 Westland Ave
- 1751 Bide A Wee Park Ave
- 1800 E Fulton St
- 696 Vernon Rd
- 751 Bulen Ave
- 572 Bulen Ave
- 639 Bulen Ave
- 895 Grandon Ave
- 1052 S Roosevelt Ave
- 1747 E Mound St
- 1779 E Main St
- 789 Chelsea Ave
- 810 Sheridan Ave
- 824 Sheridan Ave Unit 826
- 804 Sheridan Ave
- 834 Sheridan Ave
- 798-800 Sheridan Ave
- 798 Sheridan Ave Unit 800
- 815 College Ave
- 840 Sheridan Ave
- 825 College Ave
- 807 College Ave
- 792 Sheridan Ave Unit 94
- 833 College Ave Unit 35
- 801 College Ave
- 833-835 College Ave
- 850 Sheridan Ave
- 839 Sheridan Ave
- 839 Sheridan Ave
- 845 College Ave
- 782 Sheridan Ave Unit 84
- 793 College Ave