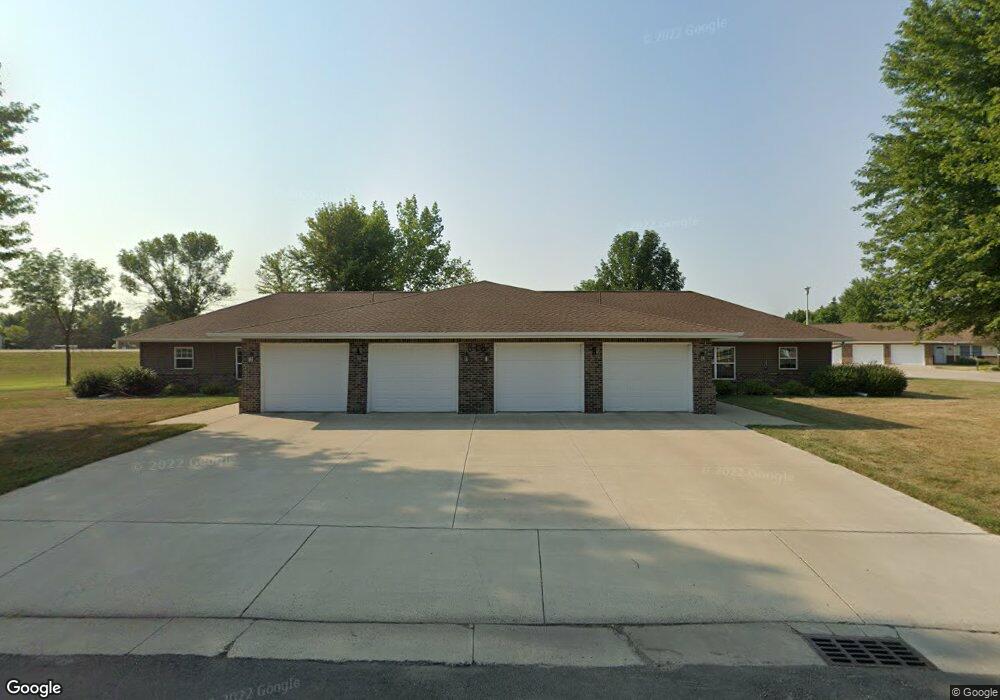
818 Southview Ct W Unit U1 Marshall, MN 56258
Estimated Value: $216,953 - $274,000
Studio
--
Bath
--
Sq Ft
2,004
Sq Ft Lot
About This Home
This home is located at 818 Southview Ct W Unit U1, Marshall, MN 56258 and is currently estimated at $248,488. 818 Southview Ct W Unit U1 is a home located in Lyon County with nearby schools including Park Side Elementary School, West Side Elementary School, and Marshall Middle School.
Ownership History
Date
Name
Owned For
Owner Type
Purchase Details
Closed on
Feb 14, 2023
Sold by
Sorenson Marilyn Ann
Bought by
County Of Lyon
Current Estimated Value
Purchase Details
Closed on
Feb 10, 2023
Sold by
Sorenson Dennis D
Bought by
Sorenson Dennis D and Sorenson Jonathan R
Purchase Details
Closed on
May 1, 2020
Sold by
Larson Deanna
Bought by
Sorenson Dennis D and Sorenson Marilyn
Purchase Details
Closed on
Oct 31, 2014
Sold by
Simpson Patricia Patricia
Bought by
Larson Deanna Deanna
Home Financials for this Owner
Home Financials are based on the most recent Mortgage that was taken out on this home.
Original Mortgage
$151,000
Interest Rate
3.98%
Purchase Details
Closed on
Aug 1, 2013
Sold by
Mitchell Kevin and Mitchell Erwin L
Bought by
Simpson Patricia
Purchase Details
Closed on
Dec 15, 2010
Sold by
Jenkins James B and Jenkins Carol K
Bought by
Mitchell Erwin L
Create a Home Valuation Report for This Property
The Home Valuation Report is an in-depth analysis detailing your home's value as well as a comparison with similar homes in the area
Home Values in the Area
Average Home Value in this Area
Purchase History
| Date | Buyer | Sale Price | Title Company |
|---|---|---|---|
| County Of Lyon | -- | -- | |
| Sorenson Dennis D | -- | None Listed On Document | |
| Sorenson Dennis D | $180,000 | None Available | |
| Larson Deanna Deanna | $152,000 | -- | |
| Simpson Patricia | -- | -- | |
| Mitchell Erwin L | -- | -- |
Source: Public Records
Mortgage History
| Date | Status | Borrower | Loan Amount |
|---|---|---|---|
| Previous Owner | Larson Deanna Deanna | $151,000 |
Source: Public Records
Tax History
| Year | Tax Paid | Tax Assessment Tax Assessment Total Assessment is a certain percentage of the fair market value that is determined by local assessors to be the total taxable value of land and additions on the property. | Land | Improvement |
|---|---|---|---|---|
| 2025 | $2,420 | $212,200 | $30,000 | $182,200 |
| 2024 | $2,048 | $206,200 | $30,000 | $176,200 |
| 2023 | $2,172 | $178,000 | $30,000 | $148,000 |
| 2022 | $2,186 | $178,000 | $30,000 | $148,000 |
| 2021 | $2,214 | $170,900 | $30,000 | $140,900 |
| 2020 | $2,242 | $170,900 | $30,000 | $140,900 |
| 2019 | $1,926 | $174,600 | $30,000 | $144,600 |
| 2018 | $1,872 | $160,800 | $30,000 | $130,800 |
| 2017 | $1,872 | $160,800 | $30,000 | $130,800 |
| 2016 | $1,822 | $0 | $0 | $0 |
| 2015 | -- | $0 | $0 | $0 |
| 2014 | -- | $0 | $0 | $0 |
Source: Public Records
Map
Nearby Homes
- 517 Locust Ave
- 503 Hawthorne Dr
- 1351 Canoga Park Dr
- 1341 Canoga Park Dr
- 821 Cullen Cir
- 1500 Ellis Ave
- 606 E Main St
- 1502 Ellis Ave
- 610 Deschepper St
- 1503 Ellis Ave
- 1102 Windstar St
- 518 Jaguar Ct
- 1505 Ellis Ave
- 1506 Ellis Ave
- 1502 Quartzite Cir
- 1507 Ellis Ave
- 1500 Diamond Dr
- 403 Sienna Ct
- 411 Sienna Ct
- 409 Sienna Ct
- 818 Southview Ct W Unit B
- 818 818 W Southview Court Unit B
- 818 818 Southview Court Unit A
- 818 W Southview Ct Unit B
- 818 Southview Ct W Unit A
- 818 Southview Ct W
- 818 W Southview Ct
- 818 Southview Dr
- 818 A 818 A Southview Court--
- 818 A 818 A Southview Ct
- 814 Southview Ct W
- 814B 814b W Southview Ct
- 814 W Southview Ct
- 814 Southview Ct W
- 816 A 816 A W Southview Ct
- 816 Southview Ct W Unit B
- 816 Southview Ct W Unit A
- 816 Southview Ct W
- 816 W Southview Ct Unit B
- 816 W Southview Ct
Your Personal Tour Guide
Ask me questions while you tour the home.