
Seller's Agent in 2026
Eliza Ghabel
Edge Realty Group
(319) 430-7320
1 in this area
82 Total Sales


Estimated Value: $92,000 - $211,000
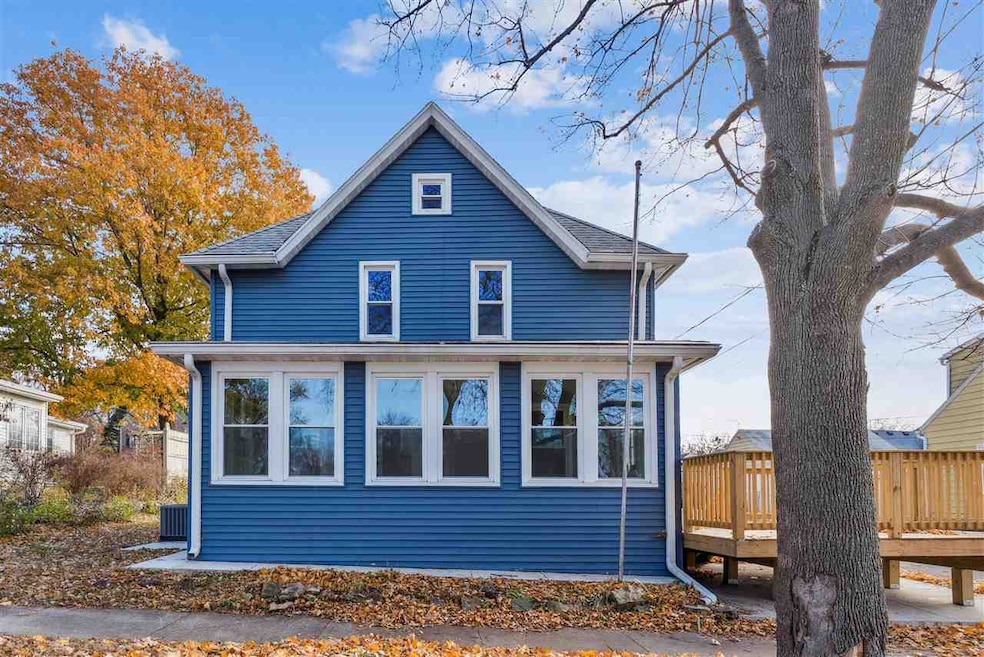
From the moment you step inside this home, you’ll feel the breath being taken away by a bright and unique space that’s been refreshed with all-new fixtures, floors, and paint. This house offers comfortable living with three bedrooms upstairs, providing flexible space for all. A hidden attic adds a touch of intrigue and lots of potential for a personal project, extra storage, or creative expansion as you bring the home to life. Modern updates meet timeless comfort in a layout designed for easy living and everyday joy. Schedule a tour to see how this refreshed residence can become your next chapter.
Last Buyer's Agent
Nonmember NONMEMBER
NONMEMBER
We collect this data history from publicly available records. To have your information removed, we recommend requesting removal directly through your county’s website.
We collect this data history from publicly available records. To have your information removed, we recommend requesting removal directly through your county’s website.
| Date | Buyer | Sale Price | Title Company |
|---|---|---|---|
| $195,000 | Title Services Corporation | ||
| $40,000 | Title Services |
We collect this data history from publicly available records. To have your information removed, we recommend requesting removal directly through your county’s website.
| Date | Status | Borrower | Loan Amount |
|---|---|---|---|
| Open | $185,185 |
We collect this data history from publicly available records. To have your information removed, we recommend requesting removal directly through your county’s website.
| Date | Event | Price | List to Sale | Price per Sq Ft |
|---|---|---|---|---|
| 01/16/2026 01/16/26 | Sold | $195,000 | -2.3% | $134 / Sq Ft |
| 12/12/2025 12/12/25 | Price Changed | $199,500 | -0.3% | $137 / Sq Ft |
| 11/14/2025 11/14/25 | For Sale | $200,000 | -- | $137 / Sq Ft |
We collect this data history from publicly available records. To have your information removed, we recommend requesting removal directly through your county’s website.
| Year | Tax Paid | Tax Assessment Tax Assessment Total Assessment is a certain percentage of the fair market value that is determined by local assessors to be the total taxable value of land and additions on the property. | Land | Improvement |
|---|---|---|---|---|
| 2025 | $1,742 | $103,970 | $16,800 | $87,170 |
| 2024 | $1,742 | $104,230 | $16,800 | $87,430 |
| 2023 | $1,540 | $104,230 | $16,800 | $87,430 |
| 2022 | $1,498 | $78,990 | $16,800 | $62,190 |
| 2021 | $1,372 | $78,990 | $16,800 | $62,190 |
| 2020 | $1,346 | $69,190 | $7,000 | $62,190 |
| 2019 | $1,346 | $69,190 | $7,000 | $62,190 |
| 2018 | $1,262 | $65,300 | $7,000 | $58,300 |
| 2017 | $1,304 | $65,300 | $7,000 | $58,300 |
| 2016 | $1,284 | $65,300 | $7,000 | $58,300 |
| 2015 | $1,284 | $65,300 | $7,000 | $58,300 |
| 2014 | $1,398 | $69,190 | $7,000 | $62,190 |
Seller's Agent in 2026
Eliza Ghabel
Edge Realty Group
(319) 430-7320
1 in this area
82 Total Sales
N
Buyer's Agent in 2026
Nonmember NONMEMBER
NONMEMBER
Source: Iowa City Area Association of REALTORS®
MLS Number: 202507007
APN: 8912-19-357-022
Disclaimer: Certain information contained herein is derived from information provided by parties other than Homes.com. All information provided is deemed reliable, but is not guaranteed to be accurate and should be independently verified.
![]() IDX information is provided exclusively for consumers’ personal, non-commercial use, that it may not be used for any purpose other than to identify prospective properties consumers may be interested in purchasing.
IDX information is provided exclusively for consumers’ personal, non-commercial use, that it may not be used for any purpose other than to identify prospective properties consumers may be interested in purchasing.
Listing information is deemed reliable, but not guaranteed accurate by the MLS.
Ask me questions while you tour the home.