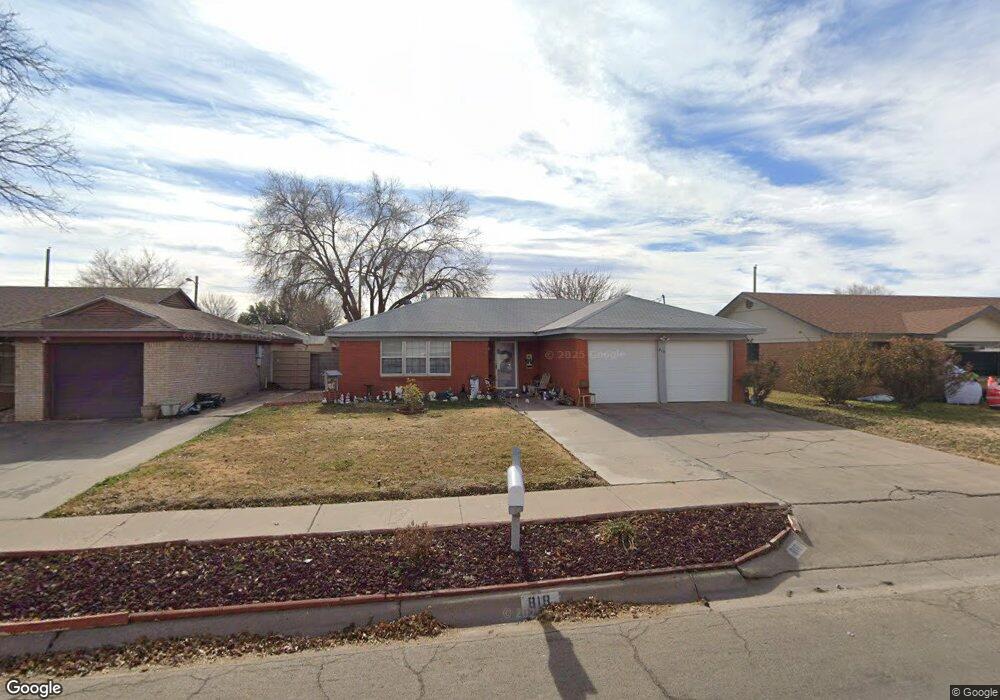
818 Trailing Heart Rd Roswell, NM 88201
Estimated Value: $60,000 - $192,000
--
Bed
--
Bath
1,404
Sq Ft
$106/Sq Ft
Est. Value
About This Home
This home is located at 818 Trailing Heart Rd, Roswell, NM 88201 and is currently estimated at $148,921, approximately $106 per square foot. 818 Trailing Heart Rd is a home located in Chaves County with nearby schools including Berrendo Elementary School, Berrendo Middle School, and Goddard High School.
Ownership History
Date
Name
Owned For
Owner Type
Purchase Details
Closed on
Feb 12, 2016
Sold by
Turner J Randy and Turner Debbie S
Bought by
Turner Nancy
Current Estimated Value
Home Financials for this Owner
Home Financials are based on the most recent Mortgage that was taken out on this home.
Original Mortgage
$90,811
Outstanding Balance
$73,431
Interest Rate
4.4%
Mortgage Type
FHA
Estimated Equity
$75,490
Purchase Details
Closed on
Aug 9, 2007
Sold by
Parker Yvette
Bought by
Turner J Randy and Turner Debbie S
Home Financials for this Owner
Home Financials are based on the most recent Mortgage that was taken out on this home.
Original Mortgage
$104,918
Interest Rate
6.42%
Mortgage Type
New Conventional
Purchase Details
Closed on
Feb 14, 2005
Sold by
Whitehead Robert G and Whitehead Grace
Bought by
Parker Yvette
Create a Home Valuation Report for This Property
The Home Valuation Report is an in-depth analysis detailing your home's value as well as a comparison with similar homes in the area
Home Values in the Area
Average Home Value in this Area
Purchase History
| Date | Buyer | Sale Price | Title Company |
|---|---|---|---|
| Turner Nancy | -- | Landmark Title | |
| Turner Nancy | -- | Skipped | |
| Turner J Randy | -- | None Available | |
| Parker Yvette | -- | None Available |
Source: Public Records
Mortgage History
| Date | Status | Borrower | Loan Amount |
|---|---|---|---|
| Open | Turner Nancy | $90,811 | |
| Closed | Turner Nancy | $90,811 | |
| Previous Owner | Turner J Randy | $104,918 |
Source: Public Records
Tax History Compared to Growth
Tax History
| Year | Tax Paid | Tax Assessment Tax Assessment Total Assessment is a certain percentage of the fair market value that is determined by local assessors to be the total taxable value of land and additions on the property. | Land | Improvement |
|---|---|---|---|---|
| 2025 | $1,170 | $44,320 | $6,000 | $38,320 |
| 2024 | $1,170 | $43,030 | $6,000 | $37,030 |
| 2023 | $1,173 | $41,777 | $6,000 | $35,777 |
| 2022 | $1,128 | $40,560 | $6,000 | $34,560 |
| 2021 | $1,119 | $39,379 | $6,000 | $33,379 |
| 2020 | $1,087 | $38,232 | $6,000 | $32,232 |
| 2019 | $1,063 | $37,470 | $6,000 | $31,470 |
| 2018 | $1,031 | $36,378 | $6,000 | $30,378 |
| 2017 | $992 | $35,319 | $6,000 | $29,319 |
| 2016 | $1,072 | $38,584 | $6,000 | $32,584 |
| 2015 | $1,162 | $37,999 | $6,000 | $31,999 |
| 2014 | $2,298 | $37,567 | $6,000 | $31,567 |
Source: Public Records
Map
Nearby Homes
- 3210 N Garden Ave
- 604 Broken Arrow Rd
- 14 La Paz St
- 8 La Paz St
- 702 Sunrise Rd
- 20 La Paz St
- 712 Mission Arch Dr
- 3008 Belmont Dr
- 3007 Edgewood Dr
- 403 Swinging Spear Rd
- 508 Sunrise Rd
- 3307 Chiquita Ln
- 309 Broken Arrow Rd
- 307 Twin Diamond Rd
- 113 N Wind Loop
- 8 Walking Cane Ln
- 300 E Linda Vista Blvd
- 703 E Mescalero Rd
- 200 Calle Del Sol
- 61 N Sky Loop
- 820 Trailing Heart Rd
- 816 Trailing Heart Rd
- 822 Trailing Heart Rd
- 814 Trailing Heart Rd
- 817 Trailing Heart Rd
- 815 E Berrendo Rd
- 819 Trailing Heart Rd
- 819 E Berrendo Rd
- 824 Trailing Heart Rd
- 812 Trailing Heart Rd
- 813 E Berrendo Rd
- 821 Trailing Heart Rd
- 815 Trailing Heart Rd
- 813 Trailing Heart Rd
- 811 E Berrendo Rd
- 823 Trailing Heart Rd
- 811 Trailing Heart Rd
- 826 Trailing Heart Rd