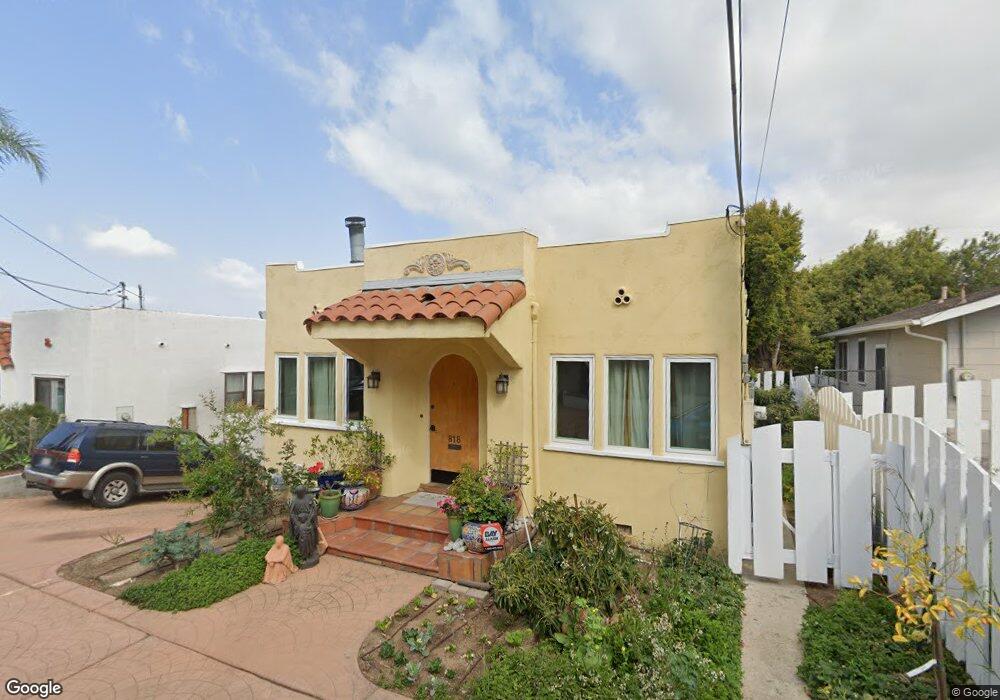
818 Vanderbilt Place San Diego, CA 92103
Hillcrest NeighborhoodEstimated Value: $1,003,167 - $1,286,000
2
Beds
1
Bath
949
Sq Ft
$1,233/Sq Ft
Est. Value
About This Home
This home is located at 818 Vanderbilt Place, San Diego, CA 92103 and is currently estimated at $1,170,292, approximately $1,233 per square foot. 818 Vanderbilt Place is a home located in San Diego County with nearby schools including Grant K-8, Richard Henry Dana Middle School, and Roosevelt International Middle School.
Ownership History
Date
Name
Owned For
Owner Type
Purchase Details
Closed on
Jun 5, 2020
Sold by
Katleman Laura J
Bought by
Laura Katleman Private Fmtr Co Inc
Current Estimated Value
Purchase Details
Closed on
May 29, 2018
Sold by
Katleman Laura J and Katleman Prue Laura
Bought by
Katleman Laura J
Purchase Details
Closed on
Mar 4, 2013
Sold by
Slert Marilyn Larson
Bought by
Katleman Prue Laura
Home Financials for this Owner
Home Financials are based on the most recent Mortgage that was taken out on this home.
Original Mortgage
$357,750
Interest Rate
3.51%
Mortgage Type
FHA
Purchase Details
Closed on
Apr 26, 2005
Sold by
Slert Norman Charles
Bought by
Slert Marilyn Larson
Purchase Details
Closed on
Dec 9, 1988
Purchase Details
Closed on
Dec 1, 1987
Purchase Details
Closed on
Sep 28, 1984
Create a Home Valuation Report for This Property
The Home Valuation Report is an in-depth analysis detailing your home's value as well as a comparison with similar homes in the area
Home Values in the Area
Average Home Value in this Area
Purchase History
| Date | Buyer | Sale Price | Title Company |
|---|---|---|---|
| Laura Katleman Private Fmtr Co Inc | -- | None Available | |
| Katleman Laura J | -- | None Available | |
| Katleman Prue Laura | $477,000 | Fidelity National Title Co | |
| Slert Marilyn Larson | -- | -- | |
| -- | $177,900 | -- | |
| -- | $153,000 | -- | |
| -- | $122,400 | -- |
Source: Public Records
Mortgage History
| Date | Status | Borrower | Loan Amount |
|---|---|---|---|
| Previous Owner | Katleman Prue Laura | $357,750 |
Source: Public Records
Tax History Compared to Growth
Tax History
| Year | Tax Paid | Tax Assessment Tax Assessment Total Assessment is a certain percentage of the fair market value that is determined by local assessors to be the total taxable value of land and additions on the property. | Land | Improvement |
|---|---|---|---|---|
| 2025 | $7,151 | $598,204 | $464,242 | $133,962 |
| 2024 | $7,151 | $586,476 | $455,140 | $131,336 |
| 2023 | $6,992 | $574,977 | $446,216 | $128,761 |
| 2022 | $6,804 | $563,704 | $437,467 | $126,237 |
| 2021 | $6,756 | $552,652 | $428,890 | $123,762 |
| 2020 | $6,552 | $537,089 | $424,493 | $112,596 |
| 2019 | $6,434 | $526,559 | $416,170 | $110,389 |
| 2018 | $6,096 | $516,235 | $408,010 | $108,225 |
| 2017 | $5,951 | $506,113 | $400,010 | $106,103 |
| 2016 | $5,856 | $496,190 | $392,167 | $104,023 |
| 2015 | $5,770 | $488,738 | $386,277 | $102,461 |
| 2014 | $5,680 | $479,165 | $378,711 | $100,454 |
Source: Public Records
Map
Nearby Homes
- 1235 1239 Lincoln Ave
- 0 Bush St Unit (35-38) 240005385
- 3505 Ibis St
- 3635 Kite St
- 3448 Goldfinch St
- 3467 Reynard Way Unit A
- 301 W Brookes Ave
- 3354 Hawk St
- 3566 Albatross St
- 3963 Eagle St Unit 8
- 3972 Jackdaw St
- 3972 Jackdaw St Unit 109
- 3568 Front St Unit D
- 1570 Linwood St
- 3320 Horton Ave
- 1695 Neale St
- 3206-16 Reynard Way
- 1694 Torrance St
- 845 Fort Stockton Dr Unit 308
- 4055 Falcon St Unit 102
- 826 Vanderbilt Place
- W W Pennsylvania
- 817 W Pennsylvania Ave
- 802 Vanderbilt Place
- 804 Vanderbilt Place
- 805 W Pennsylvania Ave
- 813 Vanderbilt Place
- 3695 Reynard Way Unit 97
- 821 Vanderbilt Place
- 3693 Reynard Way
- 803 Vanderbilt Place
- 735 W Pennsylvania Ave Unit 39
- 3689 Reynard Way Unit 3689 Reynard Way
- 827 Vanderbilt Place
- 812 Torrance St
- 810 Torrance St
- 804 Torrance St
- 727 W Pennsylvania Ave Unit 29
- 719 W Pennsylvania Ave Unit 25
- 836 W Pennsylvania Ave Unit 201