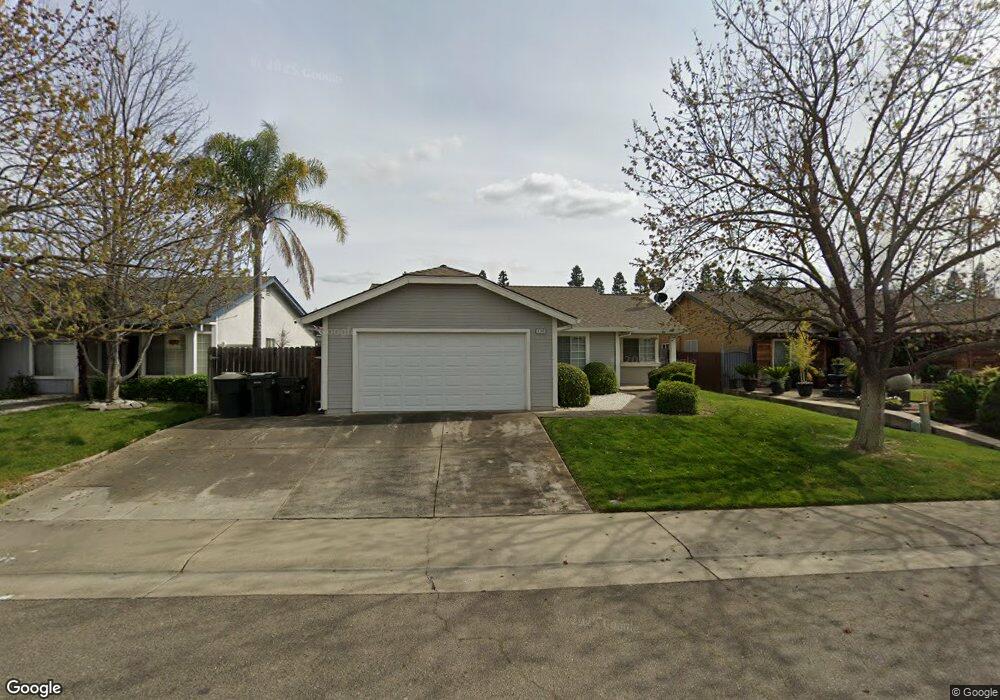
8180 Point Loma Way Sacramento, CA 95828
Estimated Value: $325,000 - $489,000
3
Beds
2
Baths
1,152
Sq Ft
$373/Sq Ft
Est. Value
About This Home
This home is located at 8180 Point Loma Way, Sacramento, CA 95828 and is currently estimated at $429,797, approximately $373 per square foot. 8180 Point Loma Way is a home located in Sacramento County with nearby schools including Isabelle Jackson Elementary School, James Rutter Middle School, and Florin High School.
Ownership History
Date
Name
Owned For
Owner Type
Purchase Details
Closed on
Jan 27, 2015
Sold by
Ramos Jason A and Ramos Elisa M
Bought by
The Ramos Living Trust
Current Estimated Value
Purchase Details
Closed on
Jun 22, 2007
Sold by
Ramos Elisa M and Valdez Elisa M
Bought by
Ramos Jason A and Ramos Elisa M
Purchase Details
Closed on
Dec 19, 1997
Sold by
Lavoi Marcus A
Bought by
Valdez Elisa M
Purchase Details
Closed on
Jul 15, 1996
Sold by
Valdez Elisa M and Lavoi Marcus A
Bought by
Valdez Elisa M and Lavoi Marcus A
Home Financials for this Owner
Home Financials are based on the most recent Mortgage that was taken out on this home.
Original Mortgage
$92,500
Interest Rate
7.96%
Purchase Details
Closed on
May 29, 1996
Sold by
Lavoi Marcus A and Valdez Elisa M
Bought by
Valdez Elisa M and Lavoi Marcus A
Home Financials for this Owner
Home Financials are based on the most recent Mortgage that was taken out on this home.
Original Mortgage
$92,500
Interest Rate
7.96%
Create a Home Valuation Report for This Property
The Home Valuation Report is an in-depth analysis detailing your home's value as well as a comparison with similar homes in the area
Home Values in the Area
Average Home Value in this Area
Purchase History
| Date | Buyer | Sale Price | Title Company |
|---|---|---|---|
| The Ramos Living Trust | -- | None Available | |
| Ramos Jason A | -- | None Available | |
| Valdez Elisa M | -- | -- | |
| Valdez Elisa M | -- | Chicago Title Co | |
| Valdez Elisa M | -- | Chicago Title Co |
Source: Public Records
Mortgage History
| Date | Status | Borrower | Loan Amount |
|---|---|---|---|
| Previous Owner | Valdez Elisa M | $92,500 |
Source: Public Records
Tax History Compared to Growth
Tax History
| Year | Tax Paid | Tax Assessment Tax Assessment Total Assessment is a certain percentage of the fair market value that is determined by local assessors to be the total taxable value of land and additions on the property. | Land | Improvement |
|---|---|---|---|---|
| 2025 | $2,152 | $189,365 | $55,173 | $134,192 |
| 2024 | $2,152 | $185,653 | $54,092 | $131,561 |
| 2023 | $2,101 | $182,014 | $53,032 | $128,982 |
| 2022 | $2,067 | $178,446 | $51,993 | $126,453 |
| 2021 | $2,045 | $174,948 | $50,974 | $123,974 |
| 2020 | $2,019 | $173,155 | $50,452 | $122,703 |
| 2019 | $1,984 | $169,761 | $49,463 | $120,298 |
| 2018 | $1,934 | $166,434 | $48,494 | $117,940 |
| 2017 | $1,902 | $163,172 | $47,544 | $115,628 |
| 2016 | $1,813 | $159,973 | $46,612 | $113,361 |
| 2015 | $1,781 | $157,571 | $45,912 | $111,659 |
| 2014 | $1,753 | $154,485 | $45,013 | $109,472 |
Source: Public Records
Map
Nearby Homes
- 8159 Morgan Hill Way
- 8216 Exbourne Cir
- 8233 Short Rd
- 8437 Yermo Way
- 8643 Rothenburg Ct
- 8170 Derbyshire Cir
- 8510 Cavendish Way
- 8247 Derbyshire Cir
- 8336 Cutler Way
- 8447 Cassatt Way
- 8548 Whitby Ct
- 8772 Crusheen Way
- 8041 Lomand Ct
- 8578 Hydrangea Ct
- 8329 Spengler Dr
- 8317 Honeycomb Way
- 8034 Kelty Ct
- 8762 Lemas Rd
- 8541 Lupin Way
- 8836 Inisheer Way
- 8184 Point Loma Way
- 8176 Point Loma Way
- 8221 Lakespring Way
- 8217 Lakespring Way
- 8188 Point Loma Way
- 8172 Point Loma Way
- 8151 Armando Ct
- 8225 Lakespring Way
- 8213 Lakespring Way
- 8138 Sonoma Hills Way
- 8171 Point Loma Way
- 8209 Lakespring Way
- 8168 Point Loma Way
- 8149 Armando Ct
- 8134 Sonoma Hills Way
- 8600 Franzia Ct
- 8601 Luciano Ct
- 8205 Lakespring Way
- 8166 Sonoma Hills Way
- 8163 Point Loma Way