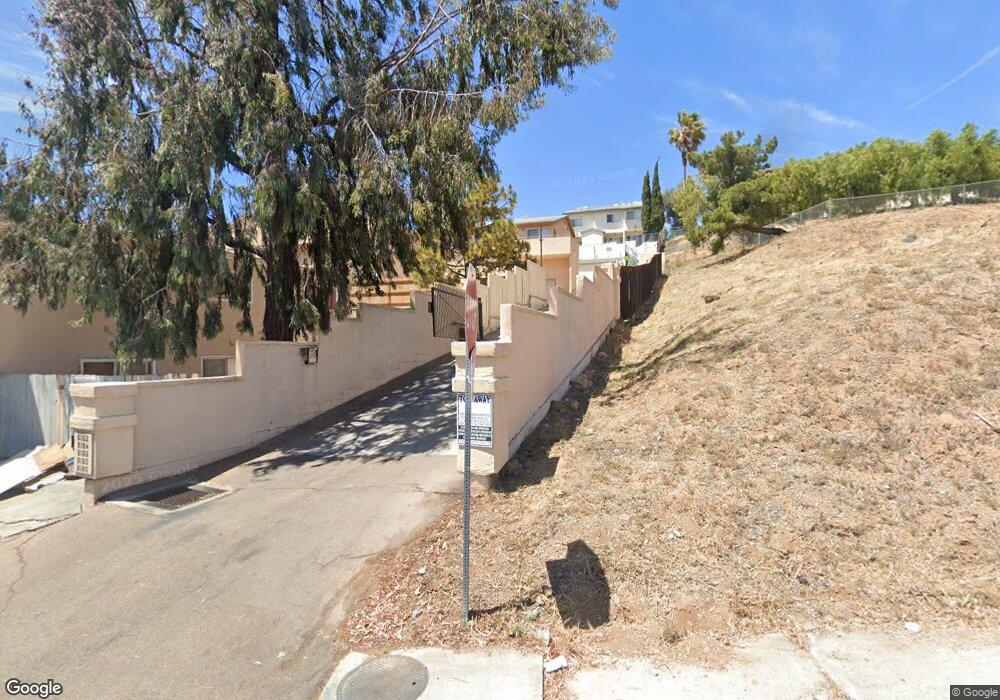
8182 Lemon Grove Way Unit F Lemon Grove, CA 91945
Estimated Value: $325,000 - $403,000
2
Beds
1
Bath
742
Sq Ft
$497/Sq Ft
Est. Value
About This Home
This home is located at 8182 Lemon Grove Way Unit F, Lemon Grove, CA 91945 and is currently estimated at $368,660, approximately $496 per square foot. 8182 Lemon Grove Way Unit F is a home located in San Diego County with nearby schools including Lemon Grove Academy Middle, Mount Miguel High School, and Sparrow Academy.
Ownership History
Date
Name
Owned For
Owner Type
Purchase Details
Closed on
Nov 4, 2008
Sold by
Fdic
Bought by
Cluff Arthur K
Current Estimated Value
Home Financials for this Owner
Home Financials are based on the most recent Mortgage that was taken out on this home.
Original Mortgage
$110,343
Outstanding Balance
$72,288
Interest Rate
6.04%
Mortgage Type
FHA
Estimated Equity
$296,372
Purchase Details
Closed on
Aug 14, 2008
Sold by
Munguia Marcela
Bought by
Indymac Bank Fsb
Purchase Details
Closed on
Aug 5, 1997
Sold by
Walkey Jonathan D
Bought by
Munguia Marcela
Home Financials for this Owner
Home Financials are based on the most recent Mortgage that was taken out on this home.
Original Mortgage
$53,185
Interest Rate
7.42%
Mortgage Type
FHA
Purchase Details
Closed on
Jul 5, 1991
Create a Home Valuation Report for This Property
The Home Valuation Report is an in-depth analysis detailing your home's value as well as a comparison with similar homes in the area
Home Values in the Area
Average Home Value in this Area
Purchase History
| Date | Buyer | Sale Price | Title Company |
|---|---|---|---|
| Cluff Arthur K | $112,000 | Chicago Title Company | |
| Indymac Bank Fsb | $115,819 | Fidelity National Title | |
| Munguia Marcela | $54,000 | Lawyers Title | |
| -- | $83,700 | -- |
Source: Public Records
Mortgage History
| Date | Status | Borrower | Loan Amount |
|---|---|---|---|
| Open | Cluff Arthur K | $110,343 | |
| Previous Owner | Munguia Marcela | $53,185 |
Source: Public Records
Tax History Compared to Growth
Tax History
| Year | Tax Paid | Tax Assessment Tax Assessment Total Assessment is a certain percentage of the fair market value that is determined by local assessors to be the total taxable value of land and additions on the property. | Land | Improvement |
|---|---|---|---|---|
| 2025 | $2,306 | $143,952 | $53,979 | $89,973 |
| 2024 | $2,306 | $141,130 | $52,921 | $88,209 |
| 2023 | $2,257 | $138,364 | $51,884 | $86,480 |
| 2022 | $2,246 | $135,652 | $50,867 | $84,785 |
| 2021 | $2,221 | $132,993 | $49,870 | $83,123 |
| 2020 | $2,188 | $131,630 | $49,359 | $82,271 |
| 2019 | $2,148 | $129,050 | $48,392 | $80,658 |
| 2018 | $2,096 | $126,521 | $47,444 | $79,077 |
| 2017 | $2,059 | $124,041 | $46,514 | $77,527 |
| 2016 | $1,978 | $121,609 | $45,602 | $76,007 |
| 2015 | $1,967 | $119,784 | $44,918 | $74,866 |
| 2014 | $1,899 | $117,439 | $44,039 | $73,400 |
Source: Public Records
Map
Nearby Homes
- 8186 Lemon Grove Way Unit E
- 8166 Lemon Grove Way Unit B
- 8050-52 Lemon Grove Way
- 3575 Grove St Unit 141
- 3635 Grove St Unit 268
- 7520 High St
- 3443 Golden View Terrace
- 8022 High St
- 8172 Golden Ave
- 8156 Golden Ave
- 8170 Golden Ave
- 8160 Golden Ave
- 8164 Golden Ave
- 8174 Golden Ave
- 8178 Golden Ave
- 8176 Golden Ave
- 8182 Golden Ave
- 8180 Golden Ave
- 8184 Golden Ave
- 8188 Golden Ave
- 8182 Lemon Grove Way Unit G
- 8182 Lemon Grove Way Unit E
- 8182 Lemon Grove Way Unit B
- 8182 Lemon Grove Way Unit A
- 8166 Lemon Grove Way Unit A
- 8162 Lemon Grove Way Unit B
- 8162 Lemon Grove Way Unit A
- 8164 Lemon Grove Way Unit B
- 8164 Lemon Grove Way Unit A
- 8186 Lemon Grove Way Unit J
- 8186 Lemon Grove Way Unit I
- 8186 Lemon Grove Way Unit H
- 8186 Lemon Grove Way Unit G
- 8186 Lemon Grove Way Unit F
- 8186 Lemon Grove Way Unit D
- 8186 Lemon Grove Way Unit C
- 8186 Lemon Grove Way Unit B
- 8186 Lemon Grove Way Unit A
- 8166 Lemon Grove Way Unit D
- 8166 Lemon Grove Way Unit C